A
B
C
D
Text Solution
Verified by Experts
The correct Answer is:


Topper's Solved these Questions
GRAPHICAL INTERPRETATION
GRB PUBLICATION|Exercise Comprehension 2|1 VideosGRAPHICAL INTERPRETATION
GRB PUBLICATION|Exercise Comprehension 3|1 VideosGRAPHICAL INTERPRETATION
GRB PUBLICATION|Exercise Comprehension 1|1 VideosF-BLOCK ELEMENTS
GRB PUBLICATION|Exercise Subjective type|7 VideosHYDROCARBON (ALIPHATIC)
GRB PUBLICATION|Exercise Previous years jee questions|28 Videos
Similar Questions
Explore conceptually related problems
GRB PUBLICATION-GRAPHICAL INTERPRETATION-Comprehension
- According to collision theory for determining the variation of rate o...
Text Solution
|
- The adsorption of a gas at a metal surface is called occlusion. The ex...
Text Solution
|
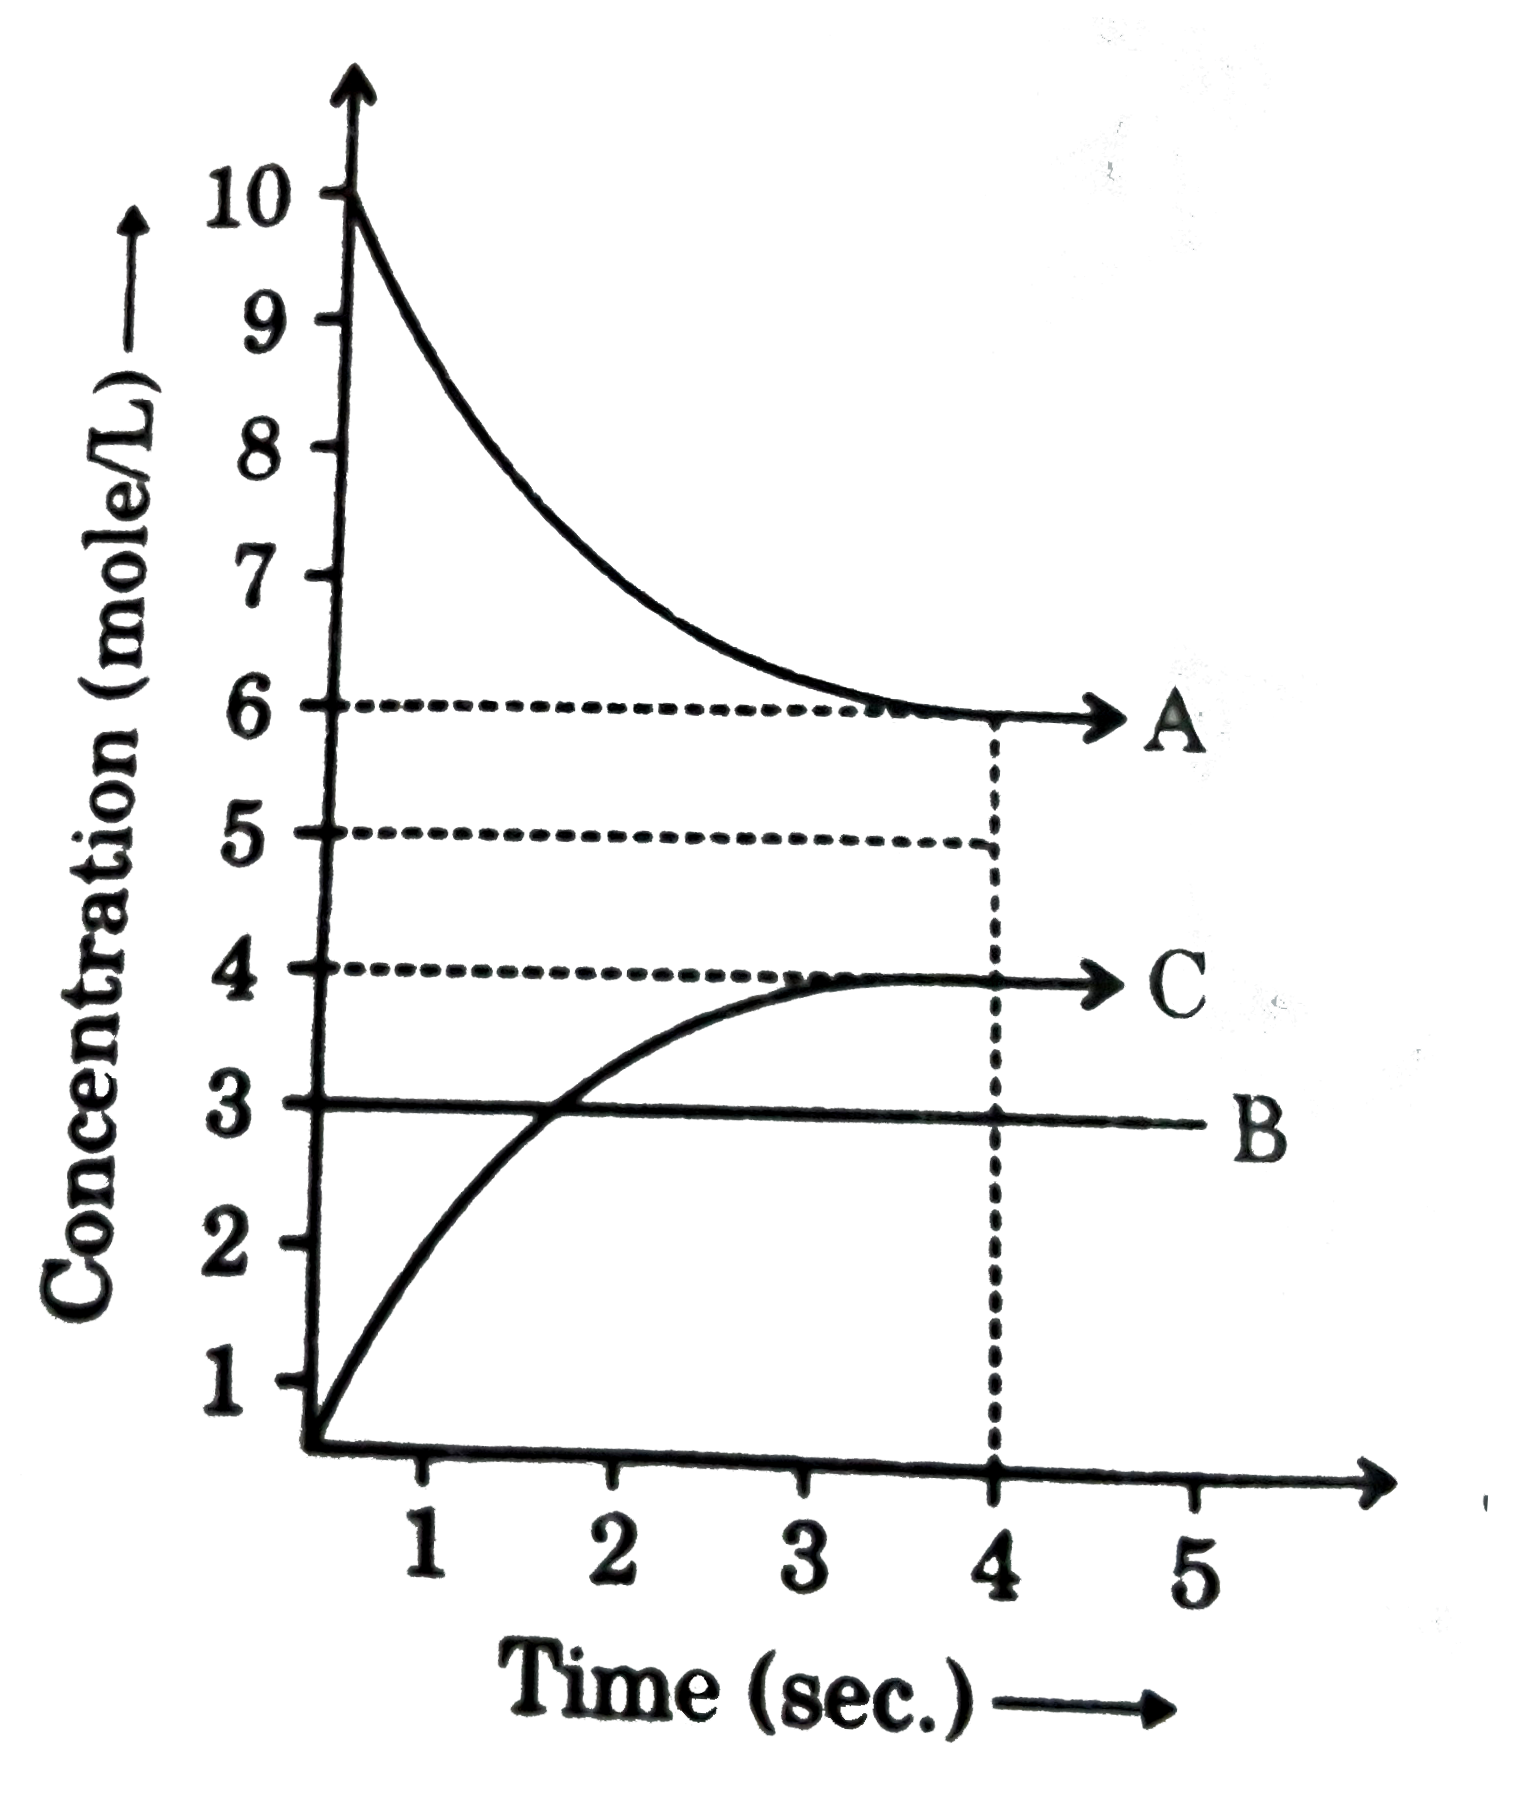
- A,B and C react in the 1:1:1 stoichiometric ratio. The concentration o...
Text Solution
|
- Above graph is plotted for 1 mole of ideal monoatomic gas. Find net ...
Text Solution
|
- The process by which a gas through a small hole into vacuum is called ...
Text Solution
|
- Titration of diprotic acid (H(2)A) by strong base has been summarised...
Text Solution
|
- Titration of diprotic acid (H(2)A) by strong base has been summarised...
Text Solution
|
- For an ideal gas if heat given in process AB is 10kJ then answer the f...
Text Solution
|
- Thermodynamics stability is often used in chemical reactions to predic...
Text Solution
|
- This type of deviation is also expected in the following mixture :
Text Solution
|
- Total vapour pressure of mixture of 1 mol of volatile component A(p(A)...
Text Solution
|
- Figure explains elevation in boiling point when a non-volatile solute ...
Text Solution
|
- Figure explains elevation in boiling point when a non-volatile solute ...
Text Solution
|
- Answer the questions (given below) which are based on the following di...
Text Solution
|
- When a liquid is completely miscible with another liquid, a homogeneou...
Text Solution
|
- When a liquid is completely miscible with another liquid, a homogeneou...
Text Solution
|
- Consider the following partially labelled figure (graph is upto scale)...
Text Solution
|
- Consider the following partially labelled figure (graph is upto scale)...
Text Solution
|
- Consider the following partially labelled figure (graph is upto scale)...
Text Solution
|
- Consider the following partially labelled figure (graph is upto scale)...
Text Solution
|