A
B
C
D
Text Solution
Verified by Experts
The correct Answer is:


Similar Questions
Explore conceptually related problems
Recommended Questions
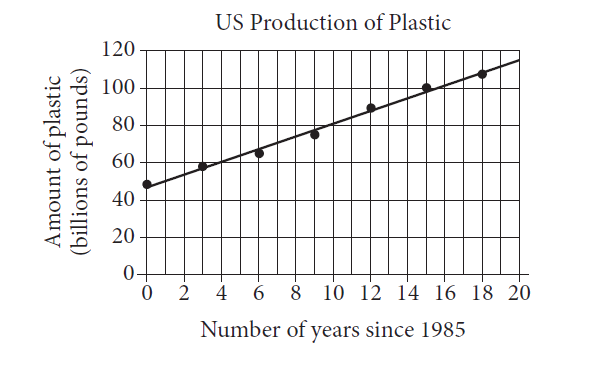
- Between 1985 and 2003, data were collected every three years on the am...
Text Solution
|
- What is the line of best fit ?
Text Solution
|
- Three commodities, their consumption and their pieces in the years 198...
Text Solution
|
- Sea ice extent is a measurement of the area of ocean with at least 15%...
Text Solution
|
- The scatterplot above shows the profit, by month, for a new company fo...
Text Solution
|
- The scatterplot above shows data collected on the lengths and widths o...
Text Solution
|
- The figure below shows the relationship between the percent of leaf li...
Text Solution
|
- Between 1985 and 2003, data were collected every three years on the am...
Text Solution
|
- The scatterplot above shows the federal-mandated minimum wage every 10...
Text Solution
|