A
B
C
D
Text Solution
Verified by Experts
The correct Answer is:


Recommended Questions
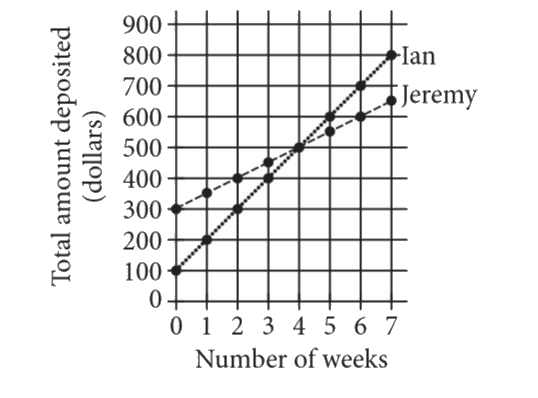
- The two graphs above show the total amounts of money that Ian and Jere...
Text Solution
|
- How many lines of symmetry does the above figure have ? <img src="http...
Text Solution
|
- Which of the following are correct chain isomers of butane ? (i) <img ...
Text Solution
|
- Determine the point of symmetry of a regular hexagon. <img src="htt...
Text Solution
|
- Dtermine the images of the following figure about the given line : ...
Text Solution
|
- Match the following Column A to Column B
Text Solution
|
- Match the following Column A to Column B
Text Solution
|
- Match the following Column A to Column B
Text Solution
|
- Find the area of the paths each having a uniform width in the followin...
Text Solution
|