 .
.


Similar Questions
Explore conceptually related problems
Recommended Questions
- Two stones are thrown up simultaneously from the edge of a cliff 200 ...
Text Solution
|
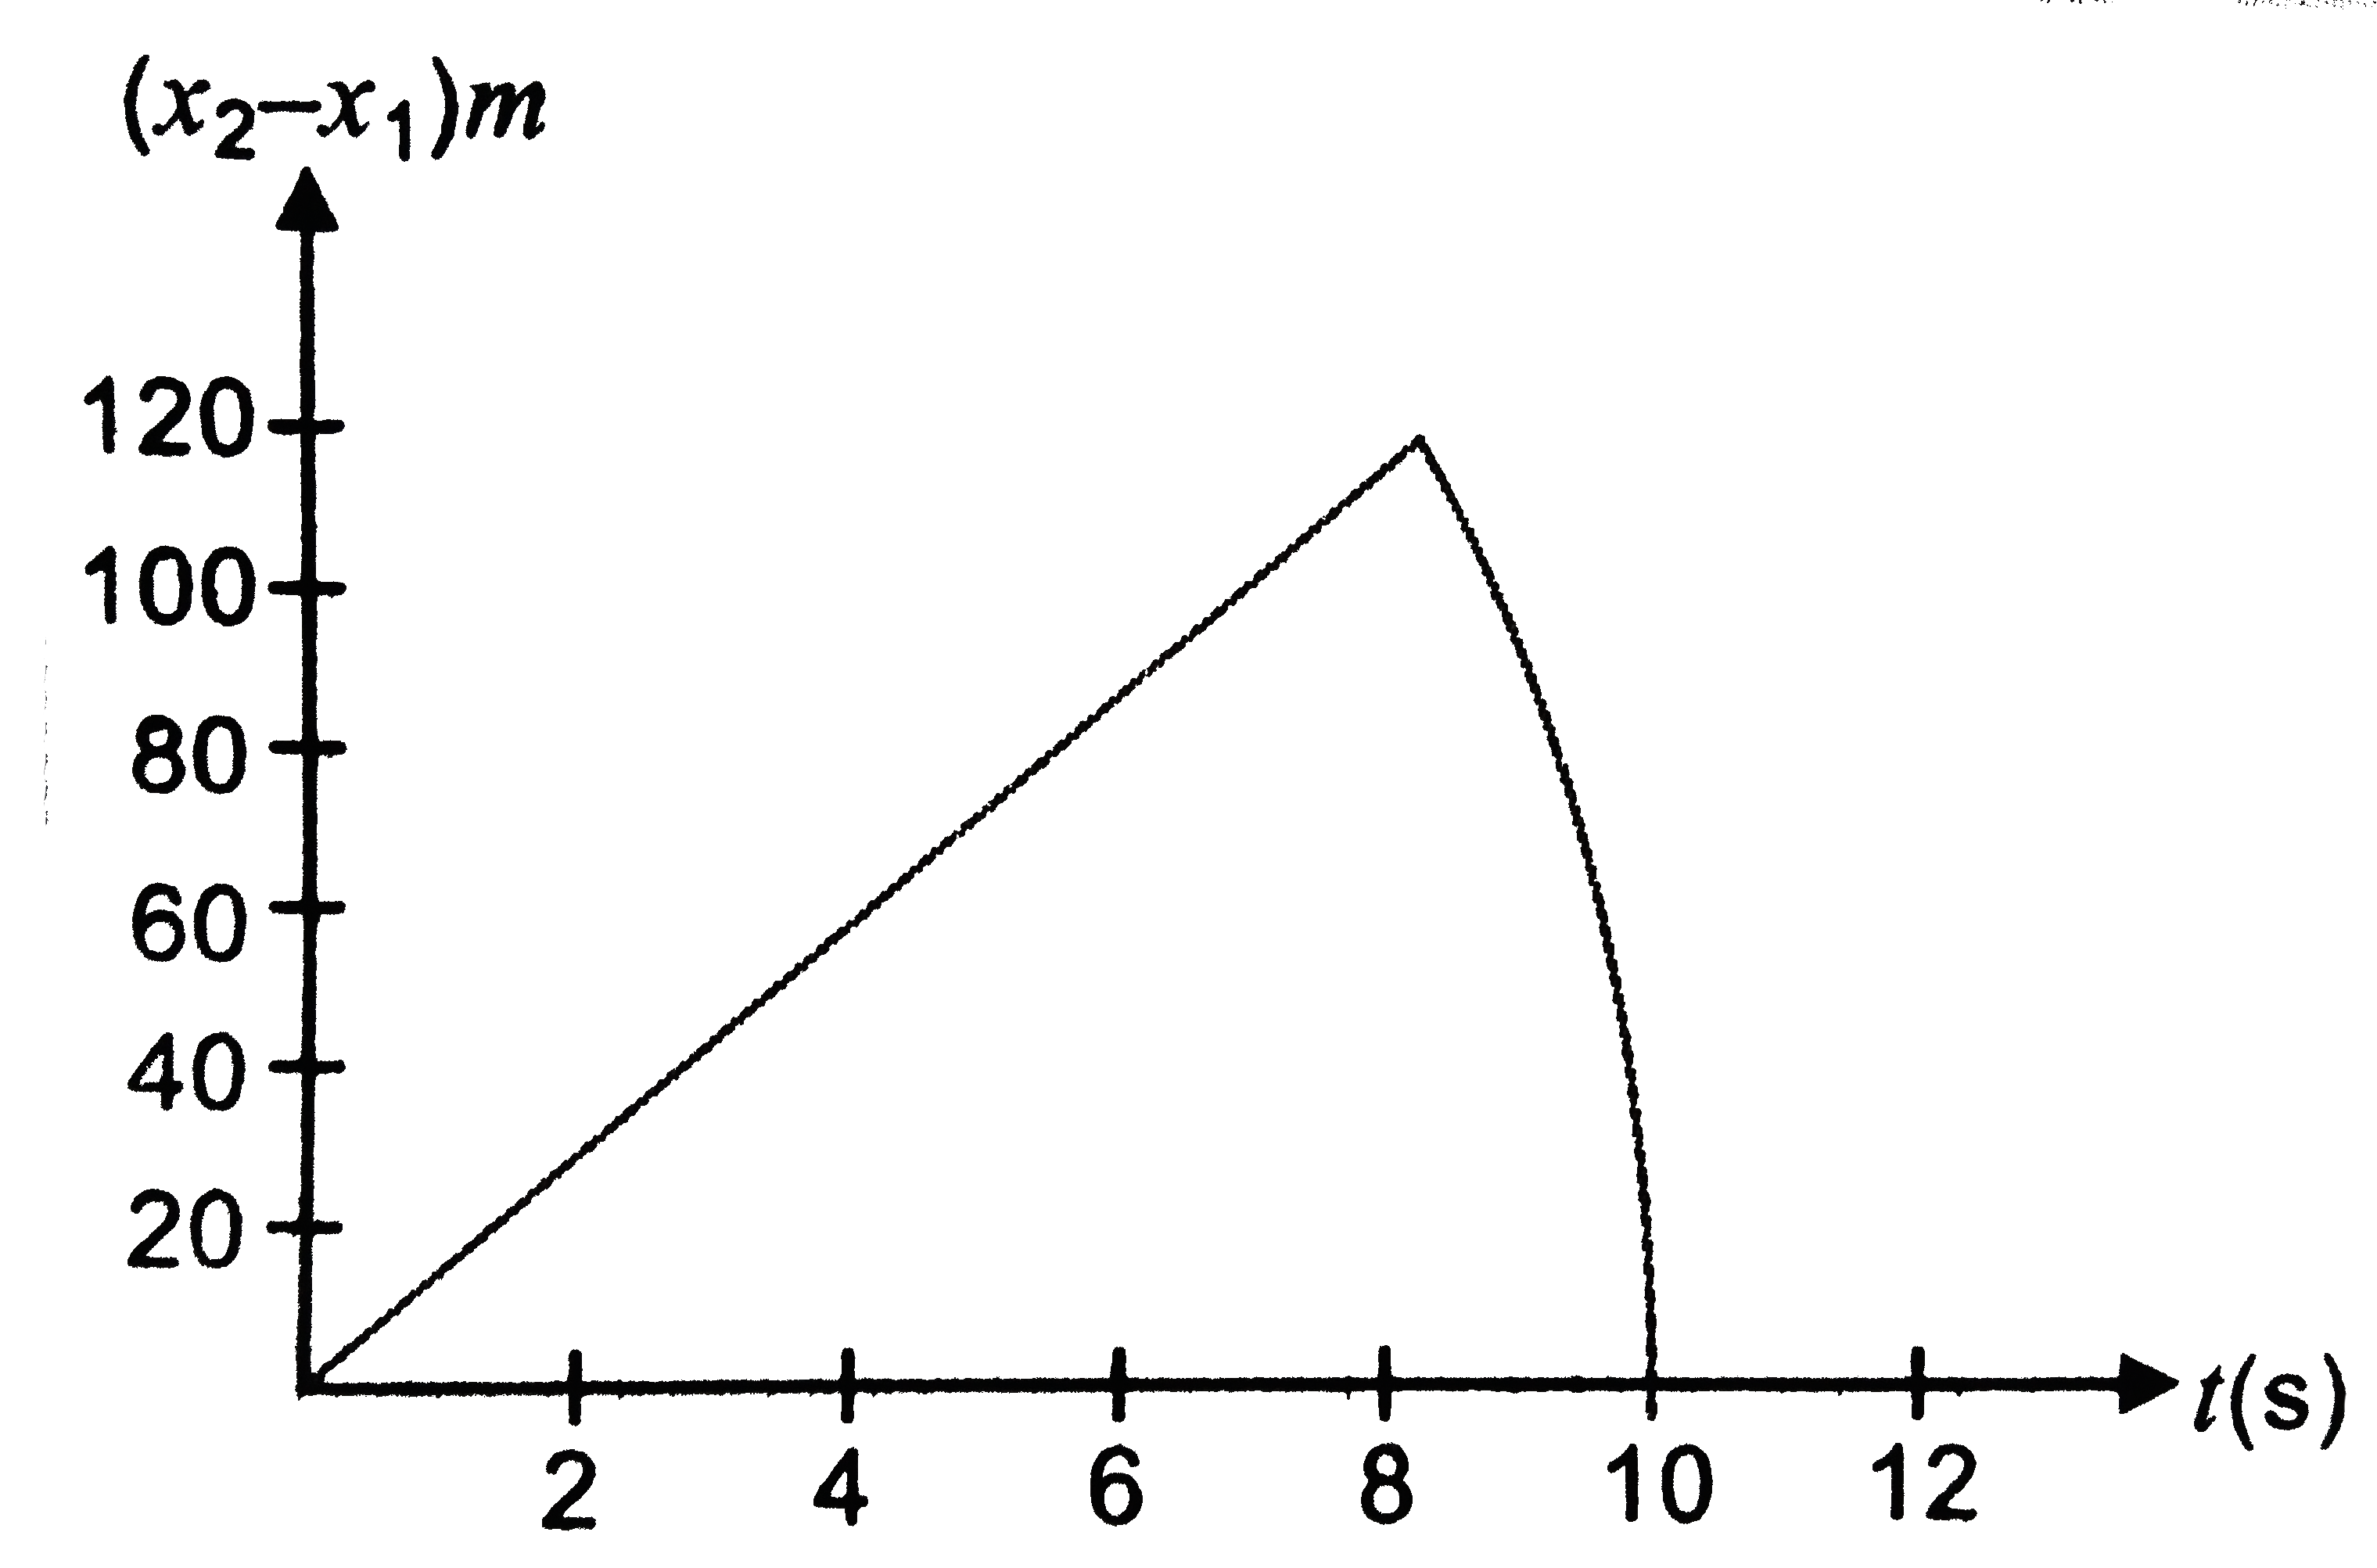
- Two stones are thrown up simultaneously from the edge of a cliff 240 m...
Text Solution
|
- Two stones are thrown up simultaneously from the edge of a cliff 200 ...
Text Solution
|
- Two stones are thrown up simultaneously from the edge of a cliff 200 m...
Text Solution
|
- Two stones are through up simultaneously from the edge of a cliff 240 ...
Text Solution
|
- किसी 200 m ऊँची खड़ी चट्टान के किनारे से दो पत्थरों को एक साथ ऊपर की ओर...
Text Solution
|
- किसी 200 m ऊँची खड़ी चट्टान के किनारे से दो पत्थरों को एक साथ ऊपर की ओर...
Text Solution
|
- Two stones are thrown up simultaneously from the edge of a cliff 240 m...
Text Solution
|
- Two stones are thrown up simultaneously from the edge of a cliff 240 m...
Text Solution
|