A
B
C
D
Text Solution
Verified by Experts
The correct Answer is:


Topper's Solved these Questions
Similar Questions
Explore conceptually related problems
DC PANDEY-CURRENT ELECTRICITY-All Questions
- A black body calorimeter filled with hot water cools from 60^(@)C to 5...
Text Solution
|
- In the process PV = constant, pressure (P) versus density (rho) graph ...
Text Solution
|
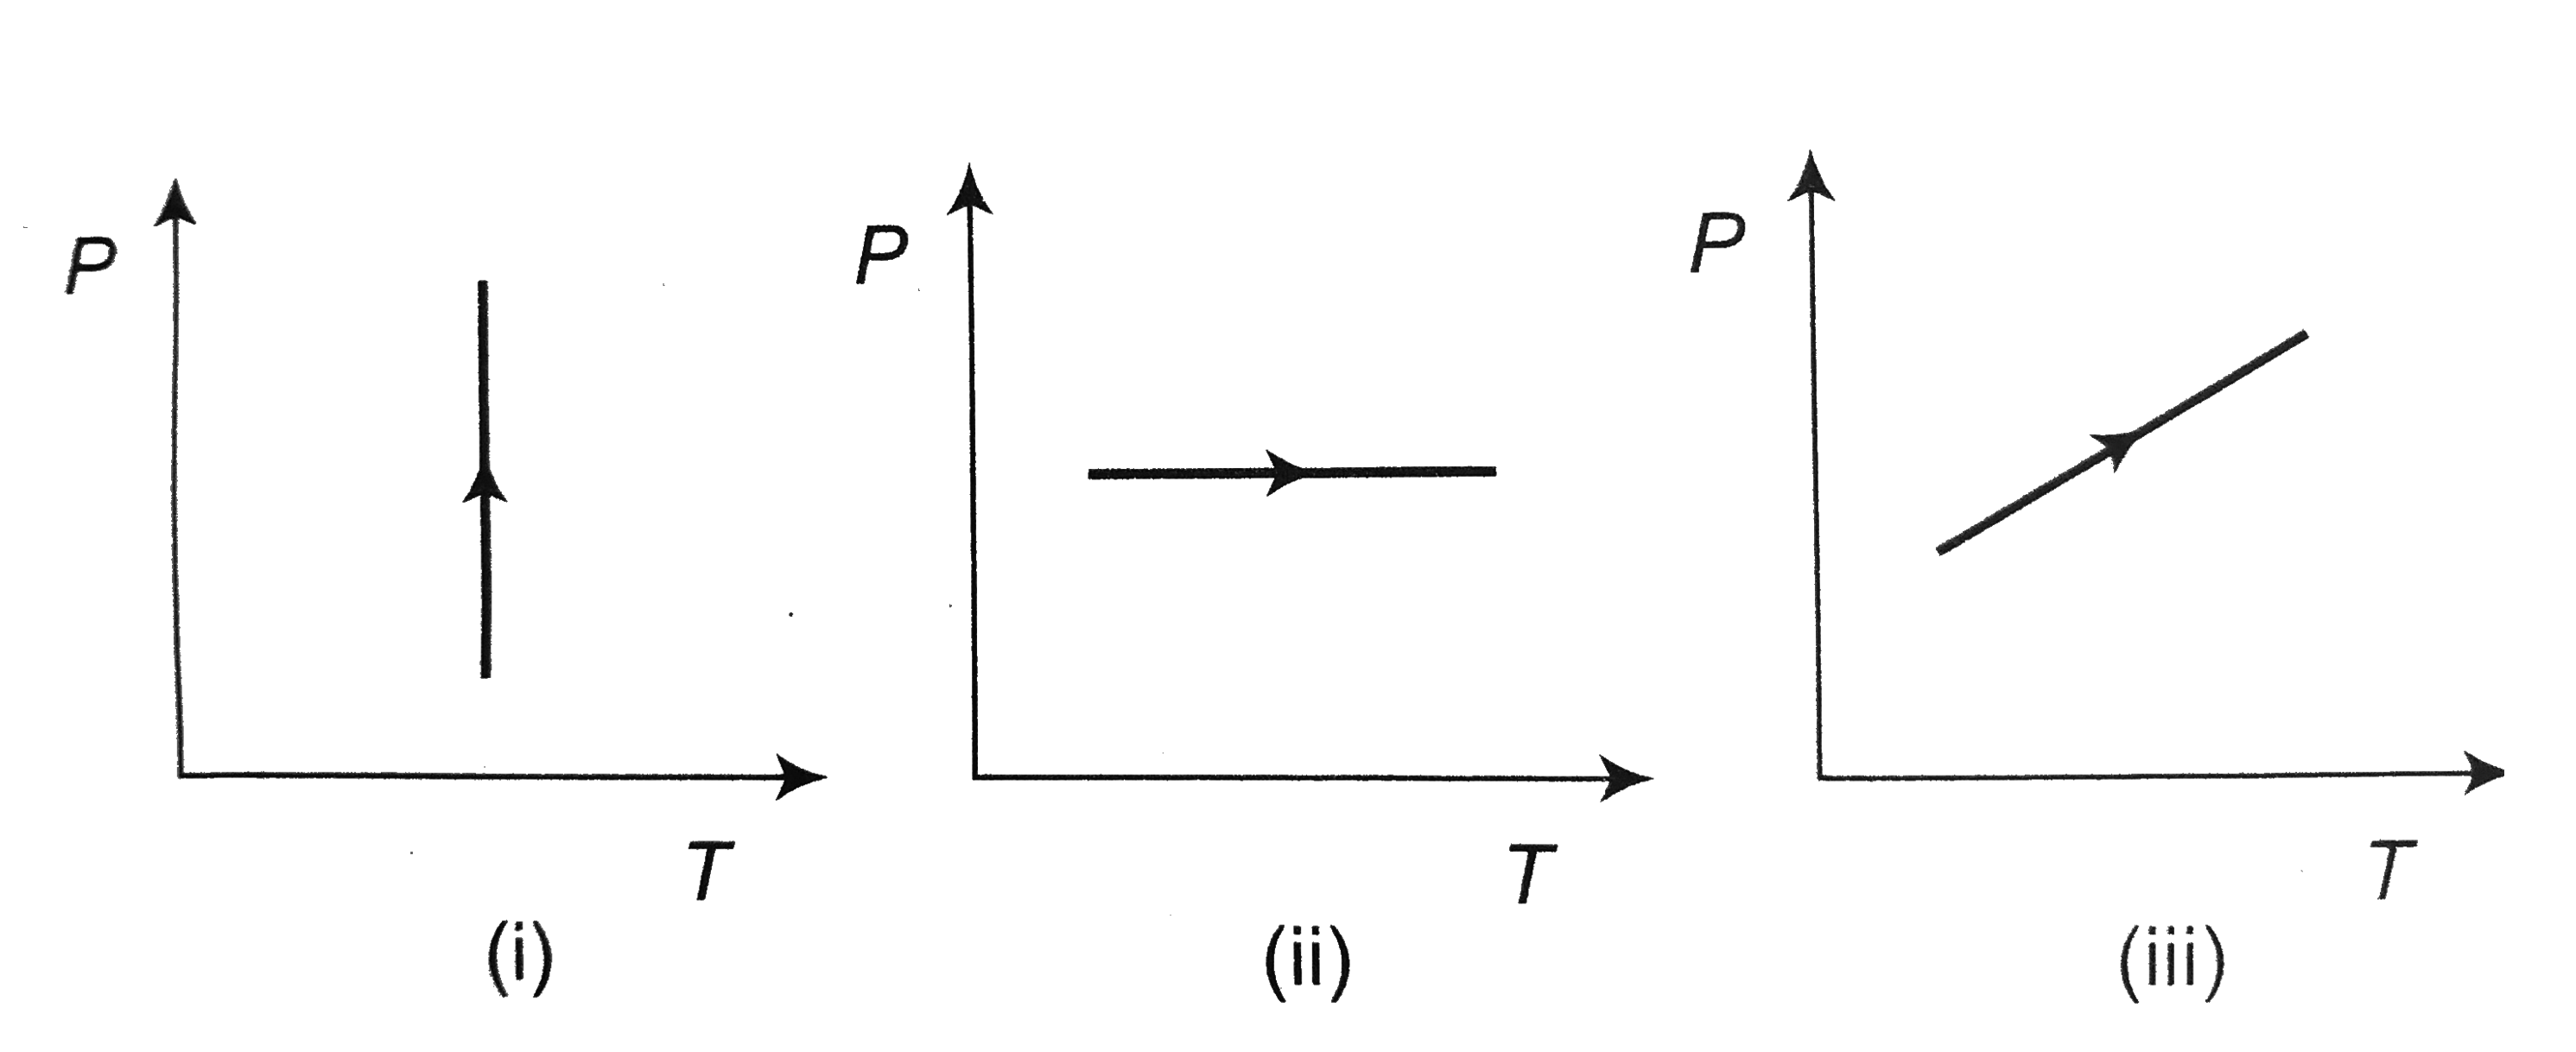
- Pressure versus temperature graphs of an ideal gas are as shown in fig...
Text Solution
|
- Change in internal energy of an ideal gas is given by DeltaU=nC(V)Delt...
Text Solution
|
- A gas is expanded to double its volume by two different processes. One...
Text Solution
|
- The quantity PV//kT represents
Text Solution
|
- The freezing point on a thermometer is marked as -20^(@) and the boili...
Text Solution
|
- If two rods of length L and 2L having coefficients of linear expansion...
Text Solution
|
- Sixty per cent of given sample of oxygen gas when raised to a high tem...
Text Solution
|
- In a cyclic process shown in the figure an ideal gas is adiabatically...
Text Solution
|
- In certain region of space there are n number of molecules per unit vo...
Text Solution
|
- If pressure and temperature of an ideal gas are doubled and volume is ...
Text Solution
|
- Internal energy of n(1) mol of hydrogen of temperature T is equal to t...
Text Solution
|
- A graph is plotted with PV/T on y-axis and mass of the gas along x-axi...
Text Solution
|
- An object is cooled from 75^(@)C to 65^(@)C in 2 min in a room at 30^(...
Text Solution
|
- In which of the following process, convection does not take place prim...
Text Solution
|
- RMS speed of a monoatomic gas is increased by 2 times. If the process ...
Text Solution
|
- Rate of heat flow through two conducting rods of identiclal dimensions...
Text Solution
|
- Which one of the following would raise the temperature of 20 g of wate...
Text Solution
|
- 120 g of ice at 0^(@)C is mixed with 100 g of water at 80^(@)C. Latent...
Text Solution
|