A
B
C
D
Text Solution
Verified by Experts
The correct Answer is:


Topper's Solved these Questions
Similar Questions
Explore conceptually related problems
DC PANDEY-CURRENT ELECTRICITY-All Questions
- A gas undergoes a change of state during which 100J of heat is supplie...
Text Solution
|
- Unit mass of liquid of volume V(1) completely turns into a gas of volu...
Text Solution
|
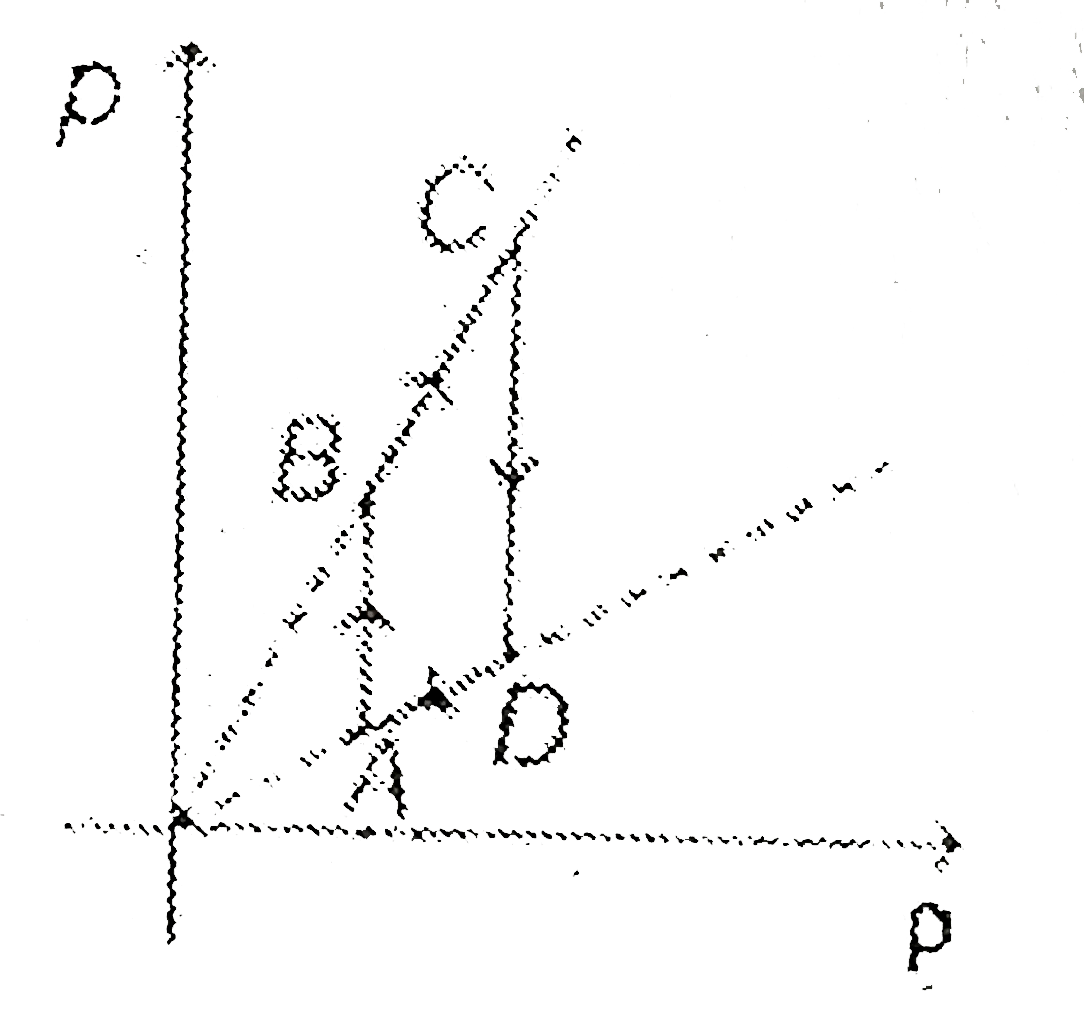
- Pressure versus density graph of an ideal gas is shown in figure
Text Solution
|
- How much heat energy should be added to a mixture of 10 g of hydrogen...
Text Solution
|
- An ideal gas mixture filled inside a balloon expands according to the ...
Text Solution
|
- Ideal gas is taken through the process shown in the figure :
Text Solution
|
- Two ends of a conducting rod of varying cross-section are maintained a...
Text Solution
|
- The specific heat of many solids at low temperatures varies with absol...
Text Solution
|
- Show that the volume thermal expansion coefficient for an ideal gas at...
Text Solution
|
- A uniform solid brass sphere is rotating with angular speed omega0 abo...
Text Solution
|
- One mole of an ideal gas undergoes a process p=(p(0))/(1+((V(0))/(V))...
Text Solution
|
- P-V diagram of a diatomic gas is a straight line passing through origi...
Text Solution
|
- The root mean spuare (rms) speed of hydrogen molecules at a certain te...
Text Solution
|
- Volume versus temperature graph of two moles of helium gas is as shown...
Text Solution
|
- Pressure versus temperature graph of an ideal gas is shown in figure. ...
Text Solution
|
- Two moles of helium are mixed with n moles of hydrogen. The root mean ...
Text Solution
|
- Pressure P, Volume V and temperature T of a certain material are relat...
Text Solution
|
- Pressure versus temperature graph of an ideal gas as shown in Fig. C...
Text Solution
|
- One end of conducting rod is maintained at temperature 50^(@)C and at ...
Text Solution
|
- The relation between U, P and V for an iodeal gas is U=2+3PV. What is ...
Text Solution
|