


DC PANDEY-CURRENT ELECTRICITY-All Questions
- Two moles of helium are mixed with n moles of hydrogen. The root mean ...
Text Solution
|
- Pressure P, Volume V and temperature T of a certain material are relat...
Text Solution
|
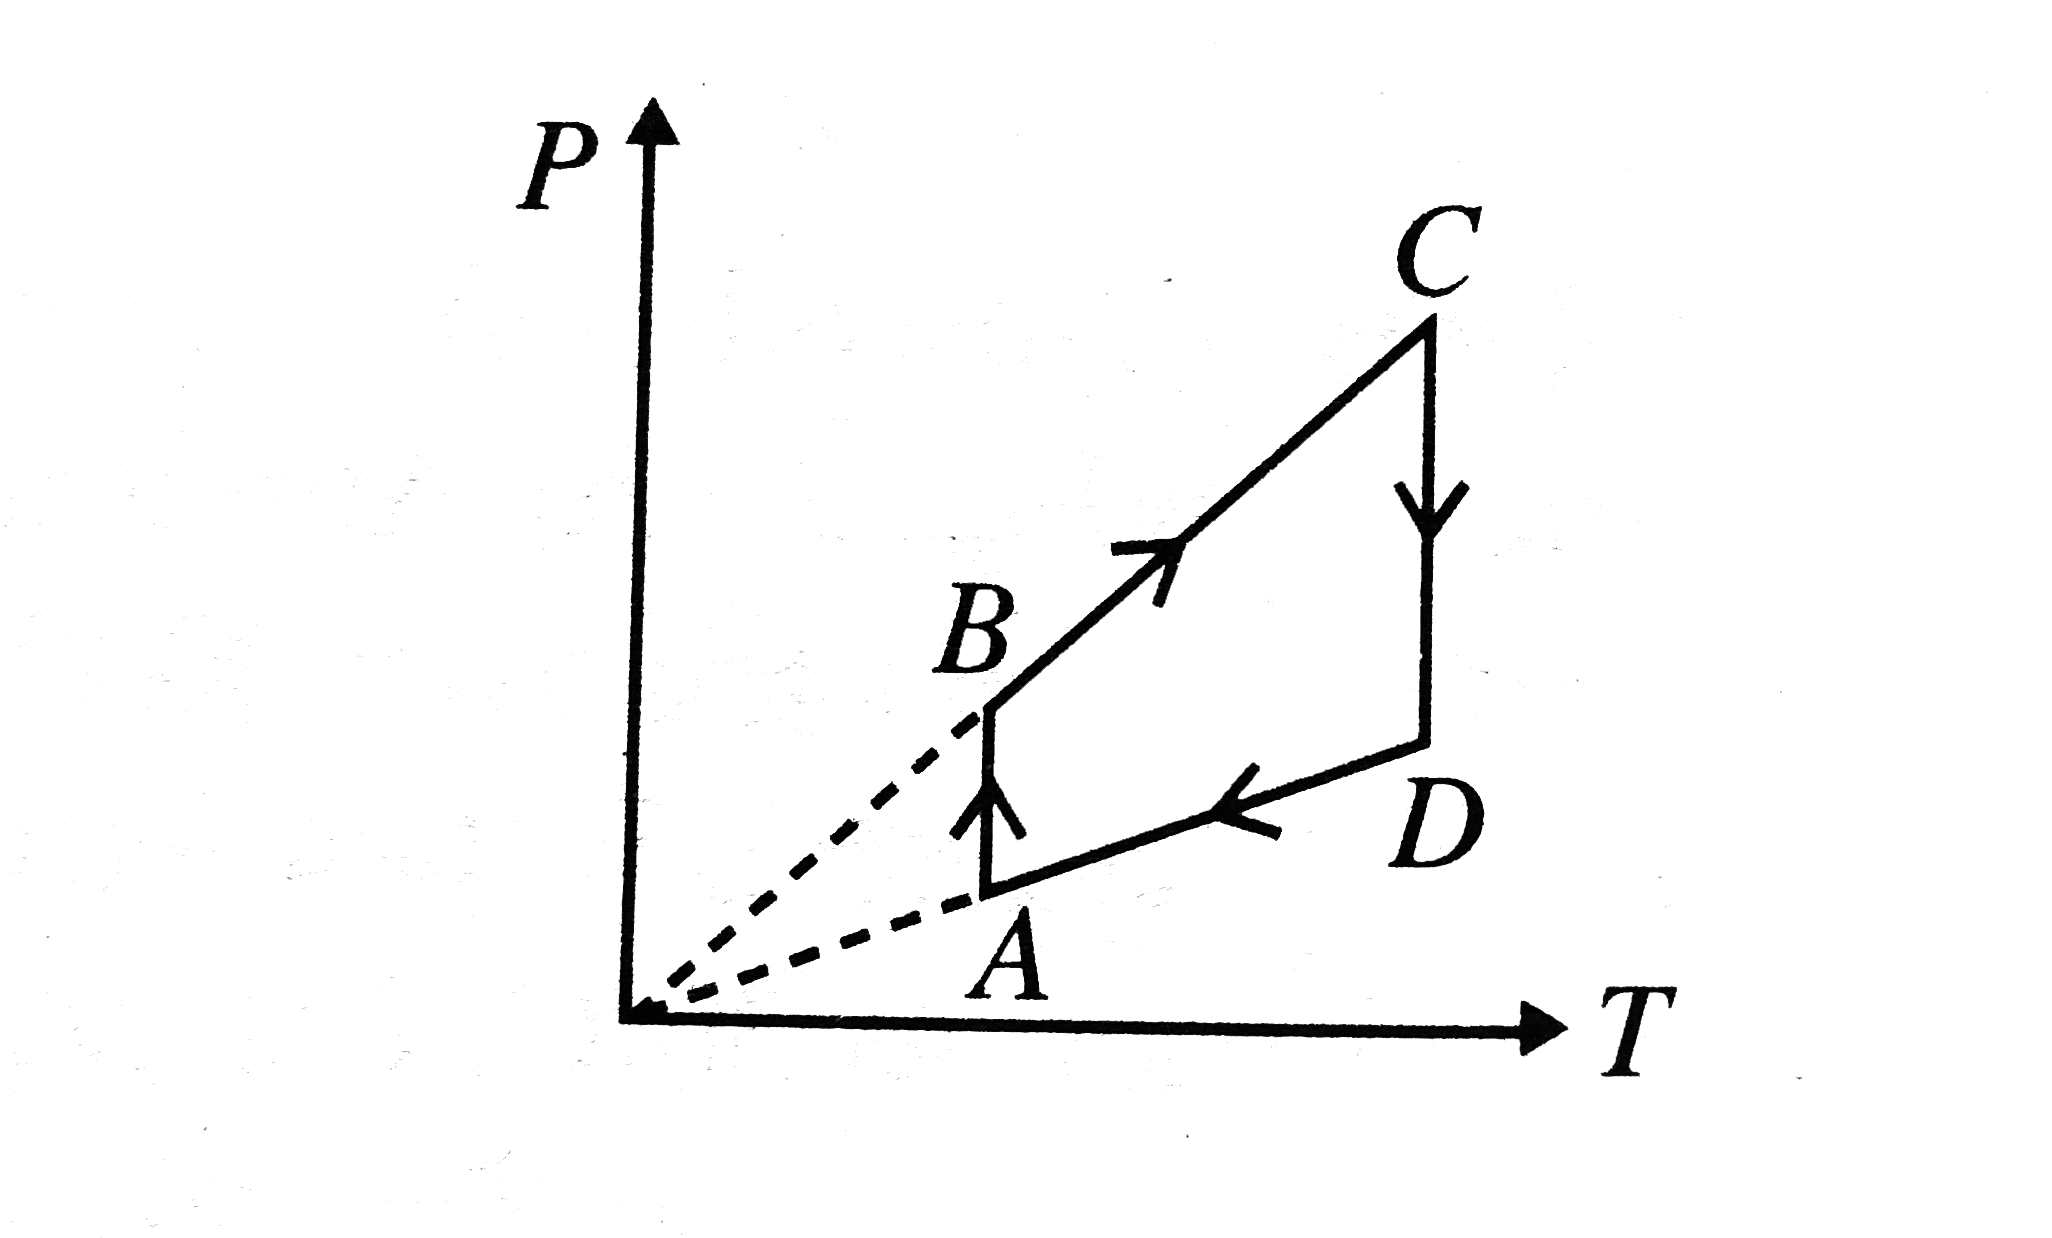
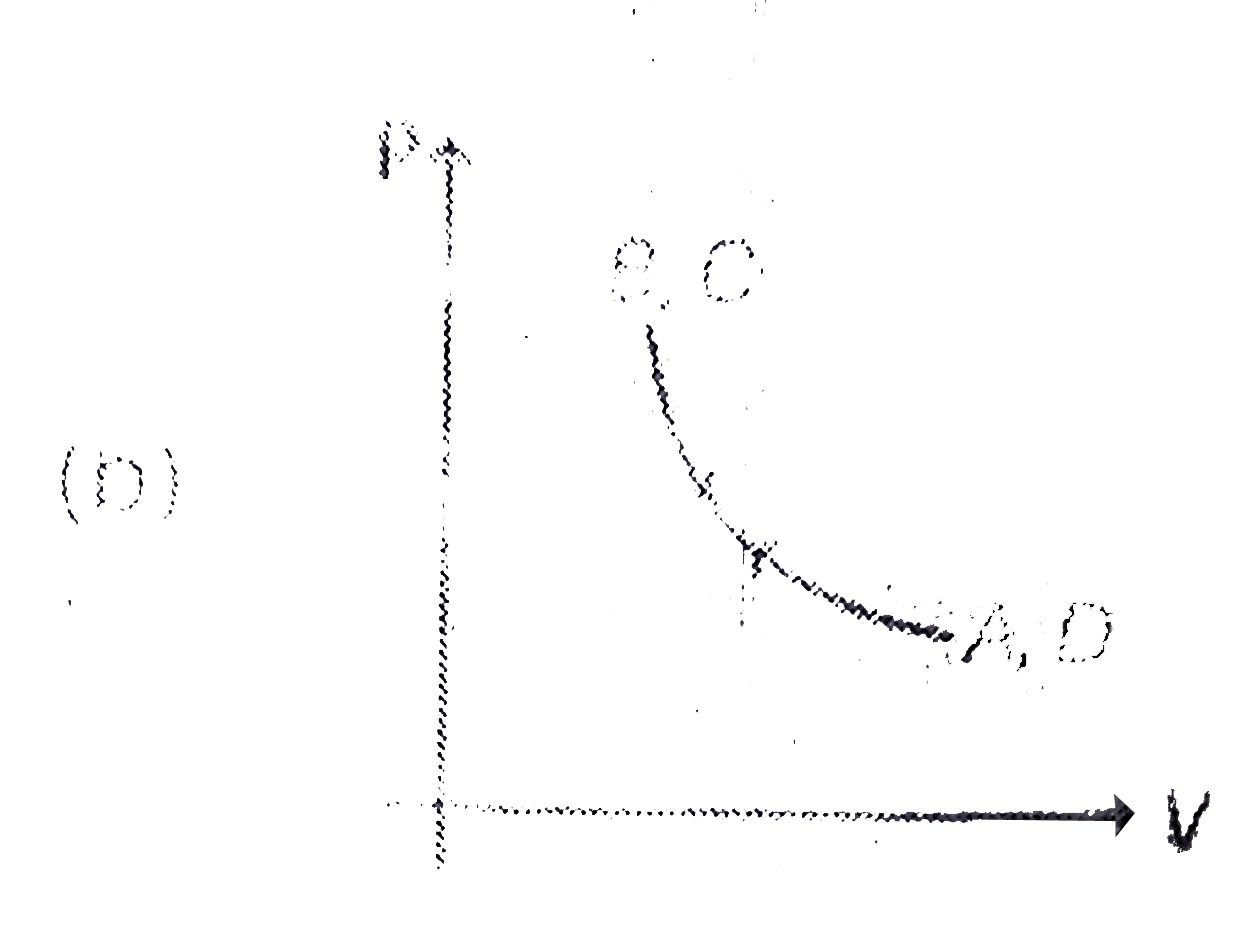
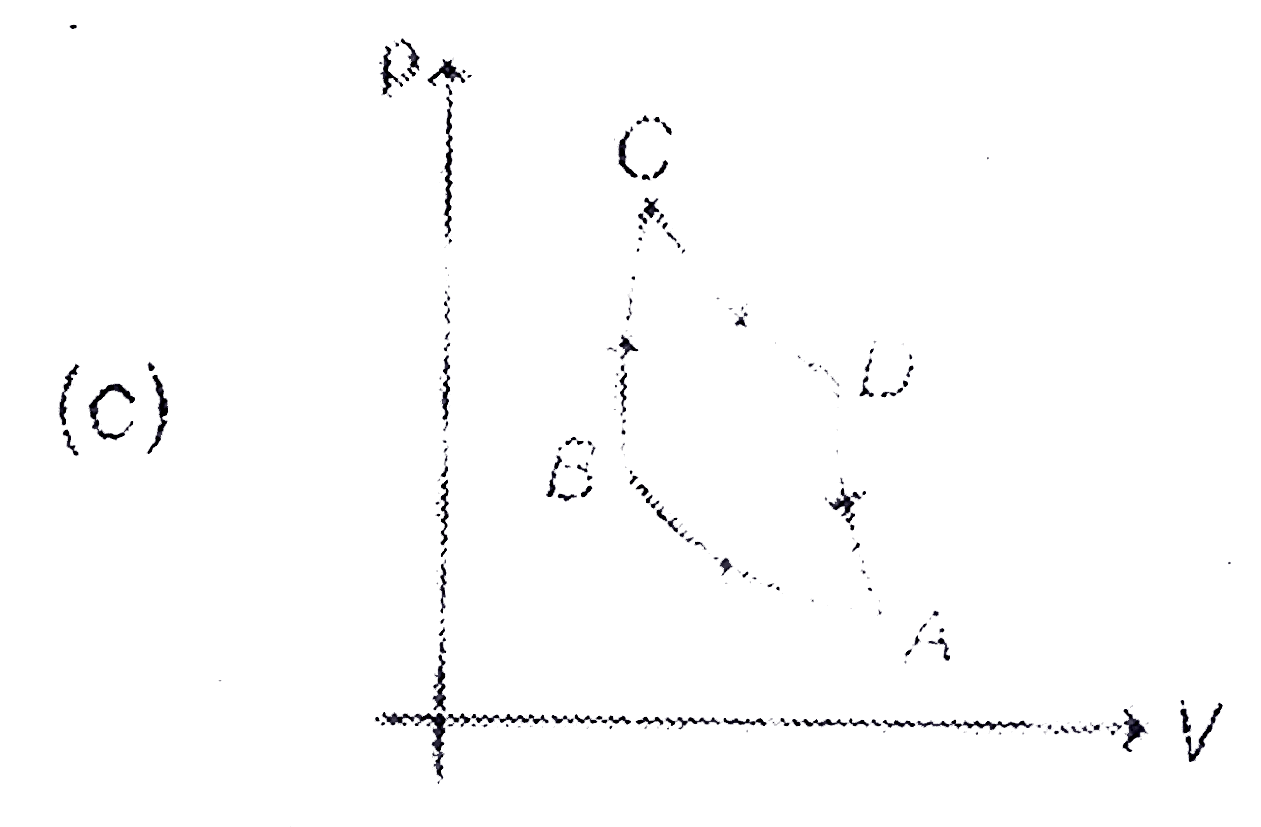
- Pressure versus temperature graph of an ideal gas as shown in Fig. C...
Text Solution
|
- One end of conducting rod is maintained at temperature 50^(@)C and at ...
Text Solution
|
- The relation between U, P and V for an iodeal gas is U=2+3PV. What is ...
Text Solution
|
- The specific heats of argon at constant pressure and constant volume a...
Text Solution
|
- Temperature of 1 mole of an ideal gas is increased from 300K to 310K u...
Text Solution
|
- One mole of an ideal monoatomic gas at temperature T0 expands slowly a...
Text Solution
|
- If the ratio of specific heat of a gas of constant pressure to that at...
Text Solution
|
- The figure shows two paths for the change of state of a gas from A to ...
Text Solution
|
- The molar heat capacity in a process of a diatomic gas if it does a wo...
Text Solution
|
- An insulator container contains 4 moles of an ideal diatomic gas at te...
Text Solution
|
- A sample of an ideal gas is taken through the cyclic process abca . It...
Text Solution
|
- Ideal monoatomic gas is taken through a process dQ = 2dU. Find the mol...
Text Solution
|
- n moles of an ideal gas undergo a process in which the temperature cha...
Text Solution
|
- One mole of a monoatomic ideal gas undergoes the process ArarrB in the...
Text Solution
|
- A monoatomic gas undergoes a process given by 2dU+3dW=0, then what is ...
Text Solution
|
- Two sheets of thickness d and 3d, are touching each other. The tempera...
Text Solution
|
- When an ideal diatomic gas is heated at constant pressure, the fractio...
Text Solution
|
- Two metallic spheres S1 and S2 are made of the same material and have ...
Text Solution
|