A
B
C
D
Text Solution
Verified by Experts


Topper's Solved these Questions
Similar Questions
Explore conceptually related problems
NARENDRA AWASTHI-IONIC EEQUILIBRIUM-Exercise
- The pH of a solution containing 0.4 M HCO(3)^(-) and 0.2 M CO(3)^(2-) ...
Text Solution
|
- The pH of the resultant solution of 20 mL of 0.1 M H(3)PO(4) and 20 mL...
Text Solution
|
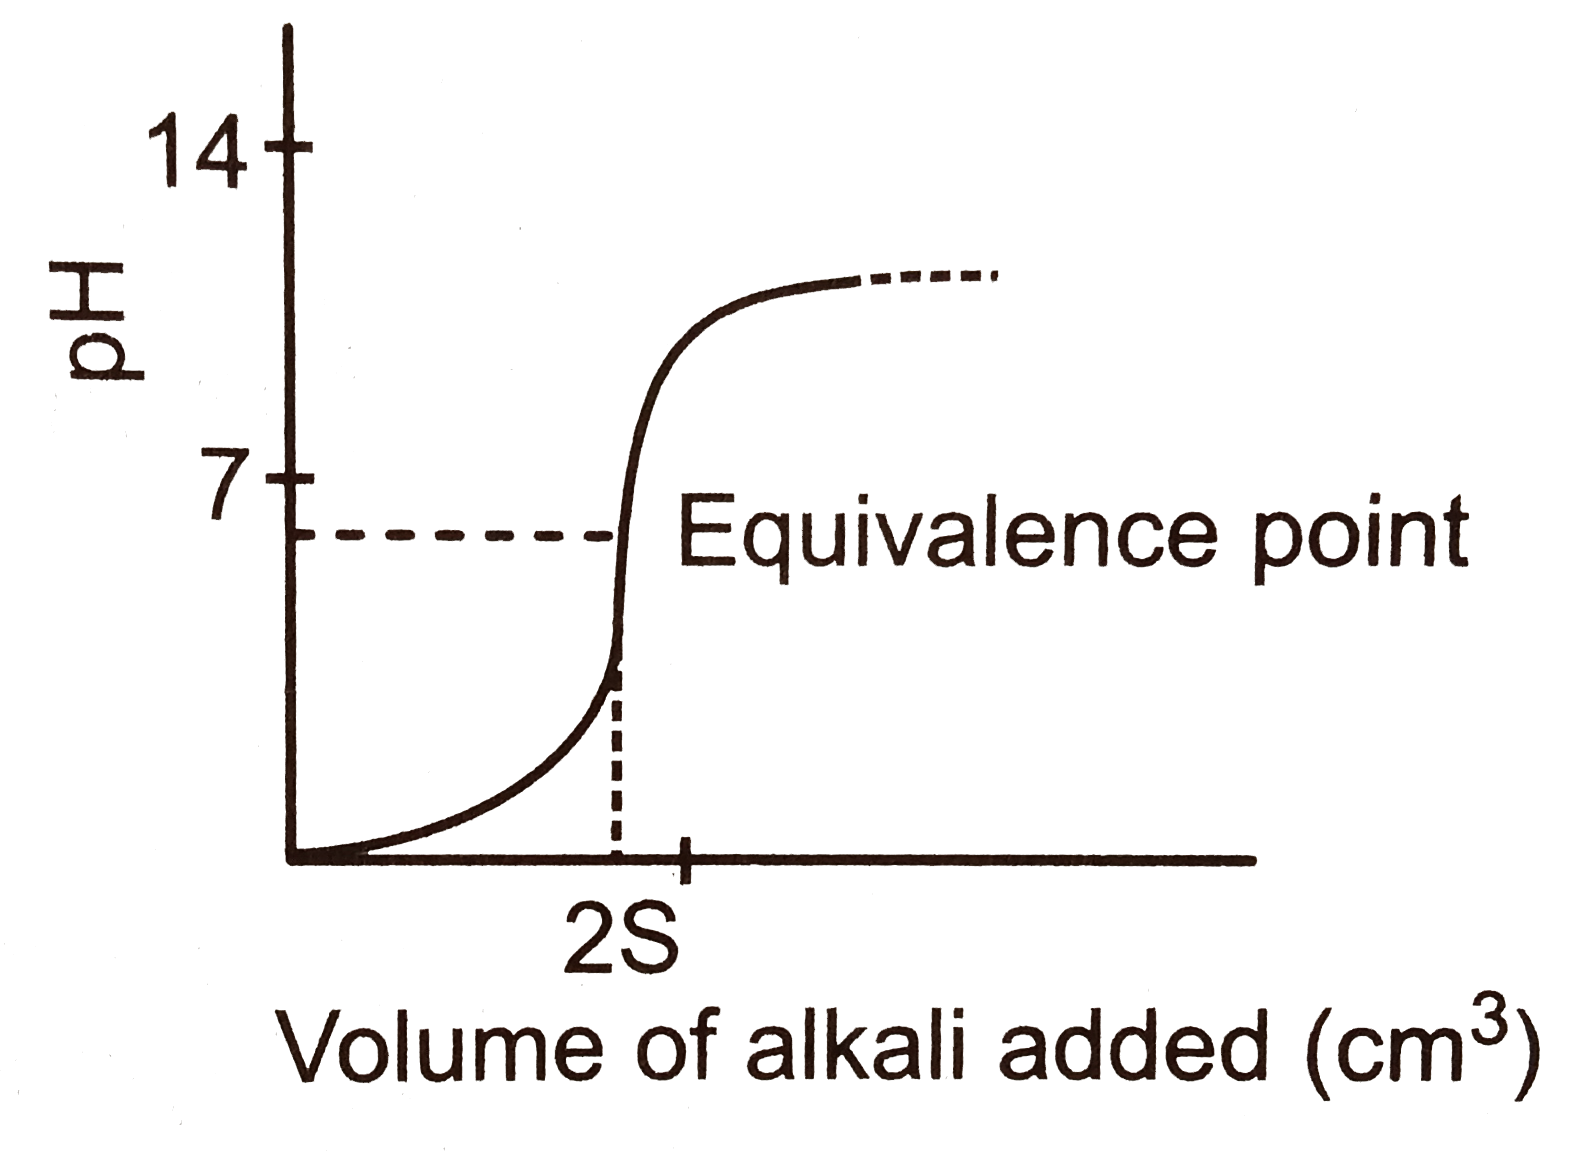
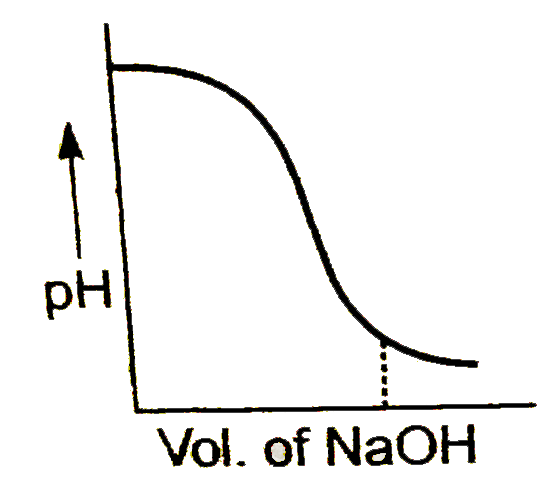
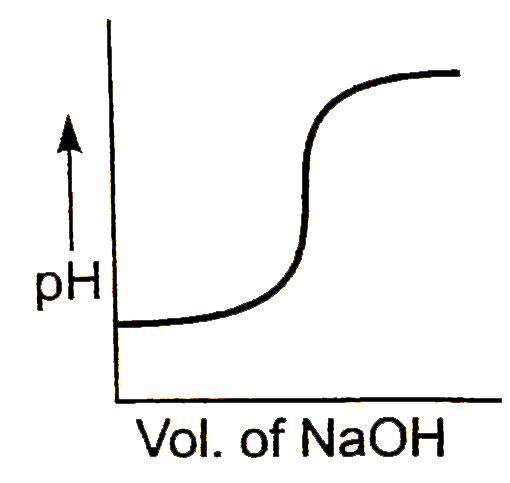
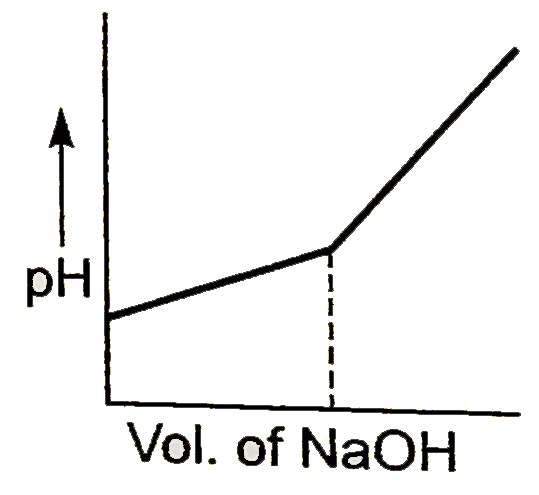
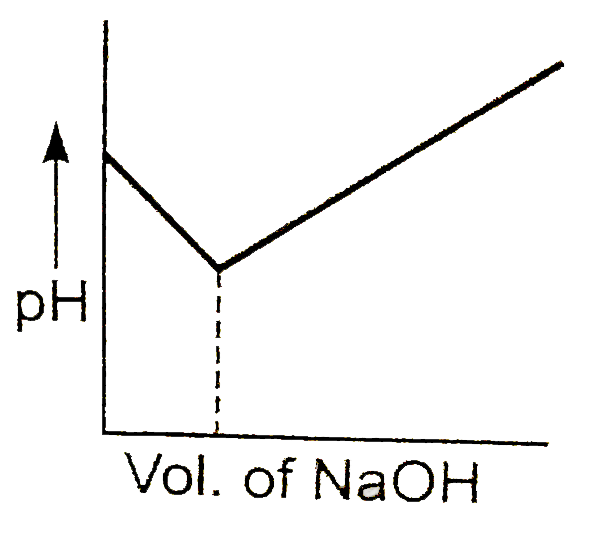
- The graph represents the titration curve for :
Text Solution
|
- When 100 mL of 0.1 M NaCN solution is titrated with 0.1 M HCl solution...
Text Solution
|
- The best indicator for the detection of the end point in the titration...
Text Solution
|
- Select the best indicator from the given table for titration of 20 mL ...
Text Solution
|
- Bromothymol blue is an indicator with a K(a) value of 6xx10^(-5). What...
Text Solution
|
- An acid-base indicator has a K(a) of 3.0 xx 10^(-5). The acid form of ...
Text Solution
|
- An acid-base indicator which is a weak acid has a pK(In) value =5.45. ...
Text Solution
|
- A 20.0 mL sample of a 0.20 M solution of the weak diprotic acid H(2)A ...
Text Solution
|
- During the titration of a weak diprotic acid (H(2)A) against a strong ...
Text Solution
|
- In which of the following cases is the solution of AgCl unsaturated?
Text Solution
|
- When equal volumes of following solution are mixed, precipitation of A...
Text Solution
|
- Choose the correct set of True/Fasle for following statements: (i) S...
Text Solution
|
- A 1 litre solution containing NH(4)Cl and NH(4)OH has hydroxide ion io...
Text Solution
|
- 150 mL of 0.0008 M ammonium sulphate is mixed with 50 mL of 0.04 M cal...
Text Solution
|
- In a saturated solution of AgCl, NaCl is added gradually. The concentr...
Text Solution
|
- K(sp) of AgCl is 1xx10^(-10). Its solubility in 0.1 M KNO(3) will be :
Text Solution
|
- 50mL of a solution containing 10^(-3) mole of Ag^(+) is mixed with 5...
Text Solution
|
- At a certain temperature, the solubility of the salt A(x)B(y) is S mol...
Text Solution
|