Home
Class 12
PHYSICS
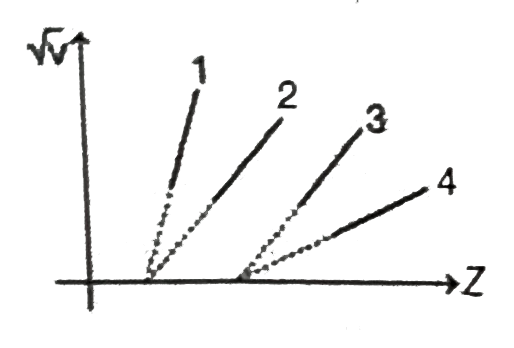
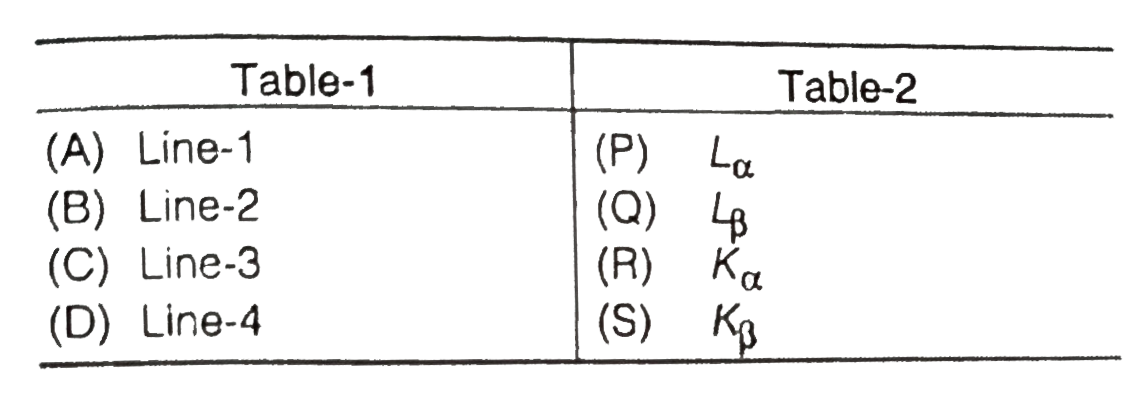
sqrt(v) versus Z graph for dcharacterist...

`sqrt(v)` versus Z graph for dcharacteristic X-rays is as shown in figure. Mathc the following

Text Solution

Verified by Experts

The correct Answer is:
A, B, C, D
Promotional Banner

Topper's Solved these Questions

  • MODERN PHYSICS

    DC PANDEY|Exercise Integer Type Questions|17 Videos
  • MODERN PHYSICS

    DC PANDEY|Exercise for JEE Advanced (More than One Options is Correct )|1 Videos
  • MAGNETISM AND MATTER

    DC PANDEY|Exercise Medical gallery|1 Videos
  • MODERN PHYSICS - 1

    DC PANDEY|Exercise Level 2 Subjective|23 Videos

Similar Questions

Explore conceptually related problems

sqrtv versus Z graph for characteristic X-rays is as shown in figure. Match the following : {:(,"Column I",,"Column II"),((A),"Line-1",(p),L_(alpha)),((B),"Line-2",(q),L_(beta)),((C),"Line-3",(r),K_(alpha)),((D),"Line-4",(s),K_(beta)):} .

The displacement versus time graph for a body moving in a straight line is shown in figure. Which of the following regions represents the motion when no force is acting on the body

Pressure versus density graph of an ideal gas is shown in figure

In the V-T graph shown in the figure match the following columns.

v-t graph of a particle in SHM is as shown is figure. Choose the wrong option.

Acceleration versus x and potential energy versus x graph of a particle moving along x-axis is as shown in figure. Mass of the particle is 1 kg and velocity at x = 0 is 4 m//s . Match the following at x = 8 m.

Moseley's law for characteristic X-rays is sqrt v = a(Z-b) . In this,

Knowledge Check

  • The displacement versus time graph for a body moving in a straight line is shown in figure. Which of the following regions represents the motion when no force is acting on the body

    A
    ab
    B
    bc
    C
    cd
    D
    de
  • Pressure versus density graph of an ideal gas is shown in figure

    A
    during the process AB work done by the gas is positive
    B
    during the process AB work done by the gas is negative
    C
    during the process BC internal energy of the gas is increasing
    D
    None of the above
  • v - t graph for rectilinear motion is given as shown in the figure. Match the column on the basis of the v-t graph.

    A
    `p-d, q-b,c, r-d, s-a `
    B
    `p-a, q-c,d, r-b, s-a `
    C
    `p-b, q-b,c, r-b, s-a`
    D
    None of these