Snow fell and then stopped for a time. When the snow began to fall again, it fell at a faster rate than it had initially. Assuming that none of the snow melted during the time indicated, which of the following graphs could model the total accumulation of snow versus time?
Snow fell and then stopped for a time. When the snow began to fall again, it fell at a faster rate than it had initially. Assuming that none of the snow melted during the time indicated, which of the following graphs could model the total accumulation of snow versus time?
A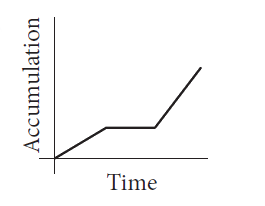
B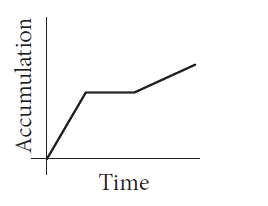
C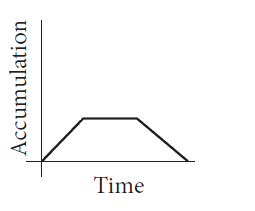
D
Text Solution
AI Generated Solution
The correct Answer is:
To solve the problem of modeling the total accumulation of snow versus time given the conditions in the question, we can break down the situation step by step.
### Step-by-Step Solution:
1. **Understanding the Situation**:
- Initially, snow falls and accumulates over time.
- After a certain period, the snow stops falling, leading to a period of no accumulation.
- When the snow begins to fall again, it does so at a faster rate than the initial snowfall.
2. **Graphing the Accumulation**:
- **First Phase (Snow Falling)**: During the initial snowfall, the accumulation of snow increases over time. This would be represented by a curve that rises steadily.
- **Second Phase (Snow Stops)**: After the snow stops falling, the accumulation remains constant. This means the graph will have a horizontal line (constant accumulation) for the duration of this phase.
- **Third Phase (Snow Falls Faster)**: When the snow resumes falling at a faster rate, the accumulation will increase again, but at a steeper slope than the initial phase. This means the graph will show a steeper upward curve.
3. **Identifying the Correct Graph**:
- We need to look for a graph that shows:
- An initial upward slope (snow falling).
- A flat line (snow stopped).
- A steeper upward slope (snow falling faster).
- Based on the description, the graph that meets these criteria would be the one that shows these three distinct phases.
4. **Evaluating the Options**:
- **Option A**: Matches the described behavior with the three phases.
- **Option B**: Shows an initial faster accumulation, which contradicts the problem statement.
- **Option C**: Indicates a decrease in accumulation, which is not possible as per the problem.
- **Option D**: Shows a constant rate of accumulation, which does not reflect the faster snowfall later.
5. **Conclusion**:
- The correct graph that models the total accumulation of snow versus time is **Option A**.
To solve the problem of modeling the total accumulation of snow versus time given the conditions in the question, we can break down the situation step by step.
### Step-by-Step Solution:
1. **Understanding the Situation**:
- Initially, snow falls and accumulates over time.
- After a certain period, the snow stops falling, leading to a period of no accumulation.
- When the snow begins to fall again, it does so at a faster rate than the initial snowfall.
...


Similar Questions
Explore conceptually related problems
The figure on the left above show saw heel with a mark on its rim. The wheel is rolling on theground at a constant rate along a level straight path from a starting point to an ending point. The graph of y=d(t)on the right could represent which of the following as a function of time from when the wheel began to roll?
Sea ice extent is a measurement of the area of ocean with at least 15% sea ice. The graph below shows data for the extent of Artic sea ice between 2000 and 2012 as reported by the National Snow and Ice Data Center. The line of best fit is also shown. The equations of the line is A(t)=-0.187t+380.5 , where A(t) represents the area of measurement sea ice in the Artic Ocean in the year t. Q. Based on the equation of the line of best fit, which of the following statements accurately of measurable Arctic sea ice during the given times period?
The following summaries describe some published research results. Research 1. Wu and Li (1985): The comparative analysis of homologous genes between human and mouse genomes suggests that the evolutionary rate of homologous genes was higher in the mouse lineage than in the human lineage. Research 2. Smith and Donohe (2008) : The plant families Caprifoliacease, Asclepiadeceae and Lamiaceae are compsed of both herbaceous and arborescent speciers. The comparative analysis of homologous genes between the herbaceous and arborescent species within a single plant family suggests that the evolutionary rate of homologous genes in herbaceous lineages were faster than of arborescent lineages in all three plant familes. Research 3. Gilman et al. (2009): The comparative analysis of 130 homologous mitochondrial genes between a sister species pair of vertebrates from the temperate region and from the tropical region indicate that the base substitution rates of homologous genes from the tropical region are 1.7 times faster than that of the temperate region. Based on these studies which of the following statements best describes the common evolutionary processes in plant and animal genes?
Two identical carts constrained to move on a straight line, on which sit two twins of same mass, are moving with equal velocity. At some time snow begins to drop uniformly. Ram, sitting on one of the carts, picks the snow from cart and throws off the falling snow sideways and in the second cart Shyam is asleep.
Recommended Questions
- Snow fell and then stopped for a time. When the snow began to fall aga...
Text Solution
|
- पहाड़ो पर बर्फ धीरे-धीरे पिघलती, है, क्यों ?
Text Solution
|
- बर्फ की ------------ अधिक होने के कारण पहाड़ों पर जमी बर्फ धीरे - धीरे ...
Text Solution
|
- Snow fell and then stopped for a time. When the snow began to fall aga...
Text Solution
|
- Snow Had Cleared Or Not
Text Solution
|
- बर्फ की अपेक्षा हिम एक अच्छा कुचालक है। क्यों?
Text Solution
|
- In February 1955, a paratrooper fell 370 m from an air plane without b...
Text Solution
|
- What happened when the dust of snow fell on the poet?
Text Solution
|
- What happened when the dust of snow fell on Robert Frost?
Text Solution
|