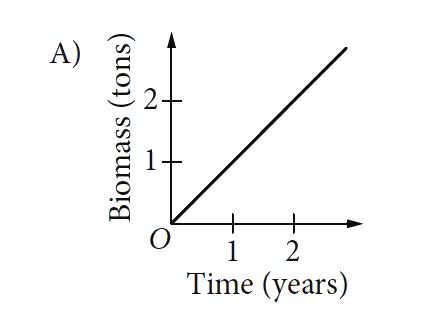
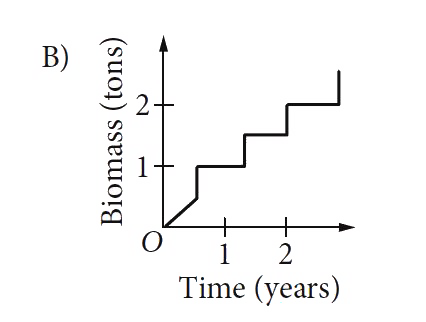
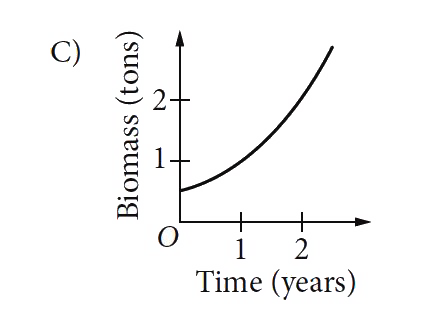
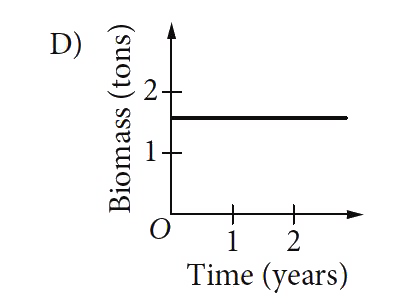
Home
Class 12
MATHS
The mass of living organisms in a lake i...

The mass of living organisms in a lake is defined to be the biomass of the lake. If the biomass in a lake doubles each year, which of the following graphs could model the biomass in the lake as a function of time? (Note: In each graph below, O represents (0, 0).)

A

B

C

D

Text Solution

AI Generated Solution

The correct Answer is:
To determine which graph models the biomass of a lake that doubles each year, we can follow these steps: ### Step 1: Understand the Concept of Doubling The problem states that the biomass in the lake doubles each year. This means that if we denote the biomass at year \( t \) as \( B(t) \), we can express it mathematically as: \[ B(t) = B(0) \times 2^t \] where \( B(0) \) is the initial biomass at year \( t = 0 \). ### Step 2: Analyze Initial Conditions Since the biomass cannot be negative or zero (as doubling zero would still yield zero), we conclude that the initial biomass \( B(0) \) must be a positive number. Thus, the graph must start above the origin (0,0). ### Step 3: Eliminate Graphs Now we can eliminate graphs based on the initial condition: - **Graphs A and B**: If these graphs start at (0,0), they cannot represent the biomass since it cannot be zero. Therefore, we eliminate these two graphs. ### Step 4: Check for Exponential Growth Next, we need to check the remaining graphs (C and D) for exponential growth: - **Graph C**: This graph should show a curve that rises steeply, indicating that the biomass is increasing exponentially as time progresses. - **Graph D**: If this graph shows a constant value or linear growth, it would not represent the doubling condition. ### Step 5: Conclusion After analyzing the remaining graphs: - **Graph C** starts at a positive value and shows exponential growth, which aligns with the condition of biomass doubling each year. - **Graph D** does not show the expected exponential growth. Thus, the correct graph that models the biomass in the lake as a function of time is **Graph C**.

To determine which graph models the biomass of a lake that doubles each year, we can follow these steps: ### Step 1: Understand the Concept of Doubling The problem states that the biomass in the lake doubles each year. This means that if we denote the biomass at year \( t \) as \( B(t) \), we can express it mathematically as: \[ B(t) = B(0) \times 2^t \] where \( B(0) \) is the initial biomass at year \( t = 0 \). ### Step 2: Analyze Initial Conditions ...
Promotional Banner