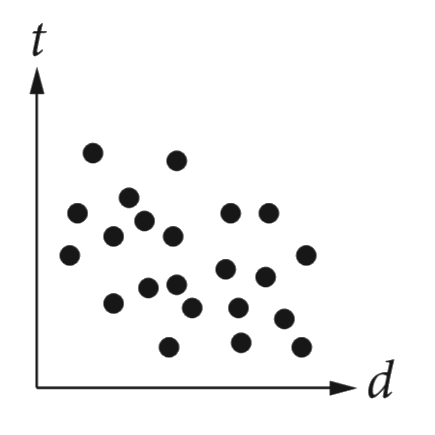
A
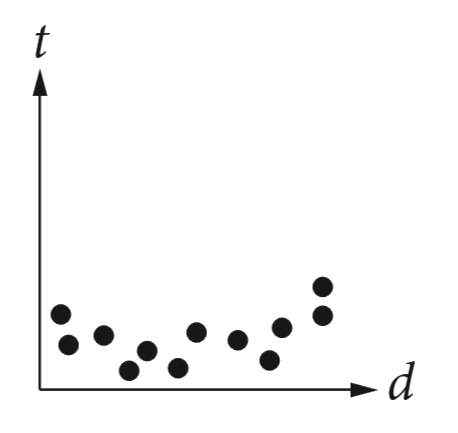
B
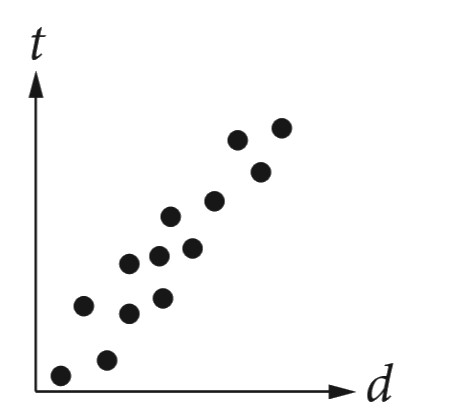
C
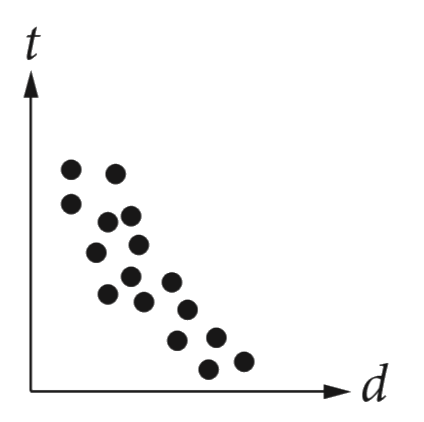
D
Text Solution
Verified by Experts
The correct Answer is:


Similar Questions
Explore conceptually related problems
Recommended Questions
- Which of the following graphs best shows a strong negative association...
Text Solution
|
- Which of the following graphs show the v - t graph of a ball thrown up...
Text Solution
|
- The graph shown the variation with times t of the velocity v of an obj...
Text Solution
|
- Assertion : In the s-t graph as shown in figure, velocity of particle ...
Text Solution
|
- Which of the following best describes the term 'Negative Demand '?
Text Solution
|
- Which of the following x-t graphs shows an object moving with negative...
Text Solution
|
- यदि log(10)[A] तथा t के मध्य ग्राफ तृणात्मक प्रवणता के साथ एक सीधी रेख...
Text Solution
|
- Which of the following graphs best shows a strong negative association...
Text Solution
|
- Which of the following graphs shows a stong positive association betwe...
Text Solution
|