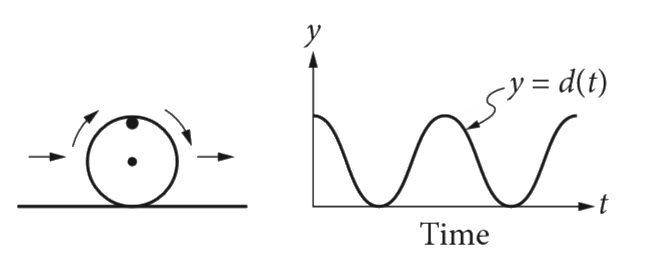
The figure on the left above show saw heel with a mark on its rim. The wheel is rolling on theground at a constant rate along a level straight path from a starting point to an ending point. The graph of y=d(t)on the right could represent which of the following as a function of time from when the wheel began to roll?
The figure on the left above show saw heel with a mark on its rim. The wheel is rolling on theground at a constant rate along a level straight path from a starting point to an ending point. The graph of y=d(t)on the right could represent which of the following as a function of time from when the wheel began to roll?
A
The speed at which the wheel is rolling
B
The distance of the wheel from its starting point
C
The distance of the mark on the rim from the centre of the wheel
D
The distance of the mark on the rim from the ground
Text Solution
Verified by Experts


Similar Questions
Explore conceptually related problems
Figure shows acceleration versus time graph of a particle starting from rest and moving along a straight line. Which of the following staement (s) is/are correct ?
A circus wishes to develop a new clown act. Fig. (1) shows a diagram of the proposed setup. A clown will be shot out of a cannot with velocity v_(0) at a trajectory that makes an angle theta=45^(@) with the ground. At this angile, the clown will travell a maximum horizontal distance. The cannot will accelerate the clown by applying a constant force of 10, 000N over a very short time of 0.24s . The height above the ground at which the clown begins his trajectory is 10m . A large hoop is to be suspended from the celling by a massless cable at just the right place so that the clown will be able to dive through it when he reaches a maximum height above the ground. After passing through the hoop he will then continue on his trajectory until arriving at the safety net. Fig (2) shows a graph of the vertical component of the clown's velocity as a function of time between the cannon and the hoop. Since the velocity depends on the mass of the particular clown performing the act, the graph shows data for serveral different masses. The slope of the line segments plotted in figure 2 is a figure constant. Which one of the following physical quantities does this slope represent?
A circus wishes to develop a new clown act. Fig. (1) shows a diagram of the proposed setup. A clown will be shot out of a cannot with velocity v_(0) at a trajectory that makes an angle theta=45^(@) with the ground. At this angile, the clown will travell a maximum horizontal distance. The cannot will accelerate the clown by applying a constant force of 10, 000N over a very short time of 0.24s . The height above the ground at which the clown begins his trajectory is 10m . A large hoop is to be suspended from the celling by a massless cable at just the right place so that the clown will be able to dive through it when he reaches a maximum height above the ground. After passing through the hoop he will then continue on his trajectory until arriving at the safety net. Fig (2) shows a graph of the vertical component of the clown's velocity as a function of time between the cannon and the hoop. Since the velocity depends on the mass of the particular clown performing the act, the graph shows data for serveral different masses. From figure 2, approximately how much time will it take for clown with a mass of 60 kg to reach the safety net located 10 m below the height of the cannot?
A circus wishes to develop a new clown act. Fig. (1) shows a diagram of the proposed setup. A clown will be shot out of a cannot with velocity v_(0) at a trajectory that makes an angle theta=45^(@) with the ground. At this angile, the clown will travell a maximum horizontal distance. The cannot will accelerate the clown by applying a constant force of 10, 000N over a very short time of 0.24s . The height above the ground at which the clown begins his trajectory is 10m . A large hoop is to be suspended from the celling by a massless cable at just the right place so that the clown will be able to dive through it when he reaches a maximum height above the ground. After passing through the hoop he will then continue on his trajectory until arriving at the safety net. Fig (2) shows a graph of the vertical component of the clown's velocity as a function of time between the cannon and the hoop. Since the velocity depends on the mass of the particular clown performing the act, the graph shows data for serveral different masses. If the angle the cannot makes with the horiaontal is increased from 45^(@) , the hoop will have to be
A circus wishes to develop a new clown act. Fig. (1) shows a diagram of the proposed setup. A clown will be shot out of a cannot with velocity v_(0) at a trajectory that makes an angle theta=45^(@) with the ground. At this angile, the clown will travell a maximum horizontal distance. The cannot will accelerate the clown by applying a constant force of 10, 000N over a very short time of 0.24s . The height above the ground at which the clown begins his trajectory is 10m . A large hoop is to be suspended from the celling by a massless cable at just the right place so that the clown will be able to dive through it when he reaches a maximum height above the ground. After passing through the hoop he will then continue on his trajectory until arriving at the safety net. Fig (2) shows a graph of the vertical component of the clown's velocity as a function of time between the cannon and the hoop. Since the velocity depends on the mass of the particular clown performing the act, the graph shows data for serveral different masses. If a clown holds on to hoop instead of passing through it, what is the position of the cable so that he doesn't hit his head on the ceiling as he swings upward?
A circus wishes to develop a new clown act. Fig. (1) shows a diagram of the proposed setup. A clown will be shot out of a cannot with velocity v_(0) at a trajectory that makes an angle theta=45^(@) with the ground. At this angile, the clown will travell a maximum horizontal distance. The cannot will accelerate the clown by applying a constant force of 10, 000N over a very short time of 0.24s . The height above the ground at which the clown begins his trajectory is 10m . A large hoop is to be suspended from the celling by a massless cable at just the right place so that the clown will be able to dive through it when he reaches a maximum height above the ground. After passing through the hoop he will then continue on his trajectory until arriving at the safety net. Fig (2) shows a graph of the vertical component of the clown's velocity as a function of time between the cannon and the hoop. Since the velocity depends on the mass of the particular clown performing the act, the graph shows data for serveral different masses. If the clown's mass is 80 kg , what initial velocity v_(0) will have as he leaves the cannot?
A circus wishes to develop a new clown act. Fig. (1) shows a diagram of the proposed setup. A clown will be shot out of a cannot with velocity v_(0) at a trajectory that makes an angle theta=45^(@) with the ground. At this angile, the clown will travell a maximum horizontal distance. The cannot will accelerate the clown by applying a constant force of 10, 000N over a very short time of 0.24s . The height above the ground at which the clown begins his trajectory is 10m . A large hoop is to be suspended from the celling by a massless cable at just the right place so that the clown will be able to dive through it when he reaches a maximum height above the ground. After passing through the hoop he will then continue on his trajectory until arriving at the safety net. Fig (2) shows a graph of the vertical component of the clown's velocity as a function of time between the cannon and the hoop. Since the velocity depends on the mass of the particular clown performing the act, the graph shows data for serveral different masses. If the mass of a clown doubles, his initial kinetic energy, mv_(0)^(2)//2 , will :-
Student studying motion observed a cart rolling at a constant rate along a striaght line. The table below gives the distance, d feet, the cart was from a reference point at 1-second intervals from t = 0 seconds to r = 5 seconds. Which of the following equations represents this relationship between d and t?
The acceleration (a)-time(t) graph for a particle moving along a straight from rest is shown in figur. Which of the following graph is the best representation of its velocity (v) with time (t) ?
The figure shows the v - t graph of a particle moving in a straight line. Starting from rest, the time after which the particle returns to its starting position is
Recommended Questions
- The figure on the left above show saw heel with a mark on its rim. The...
Text Solution
|
- How many lines of symmetry does the above figure have ? <img src="http...
Text Solution
|
- Determine the point of symmetry of a regular hexagon. <img src="htt...
Text Solution
|
- Dtermine the images of the following figure about the given line : ...
Text Solution
|
- Match the following Column A to Column B
Text Solution
|
- Match the following Column A to Column B
Text Solution
|
- Match the following Column A to Column B
Text Solution
|
- The inequation represented by the graph given below is : <img src="htt...
Text Solution
|
- The inequation that best describes the graph given below is <img src=...
Text Solution
|