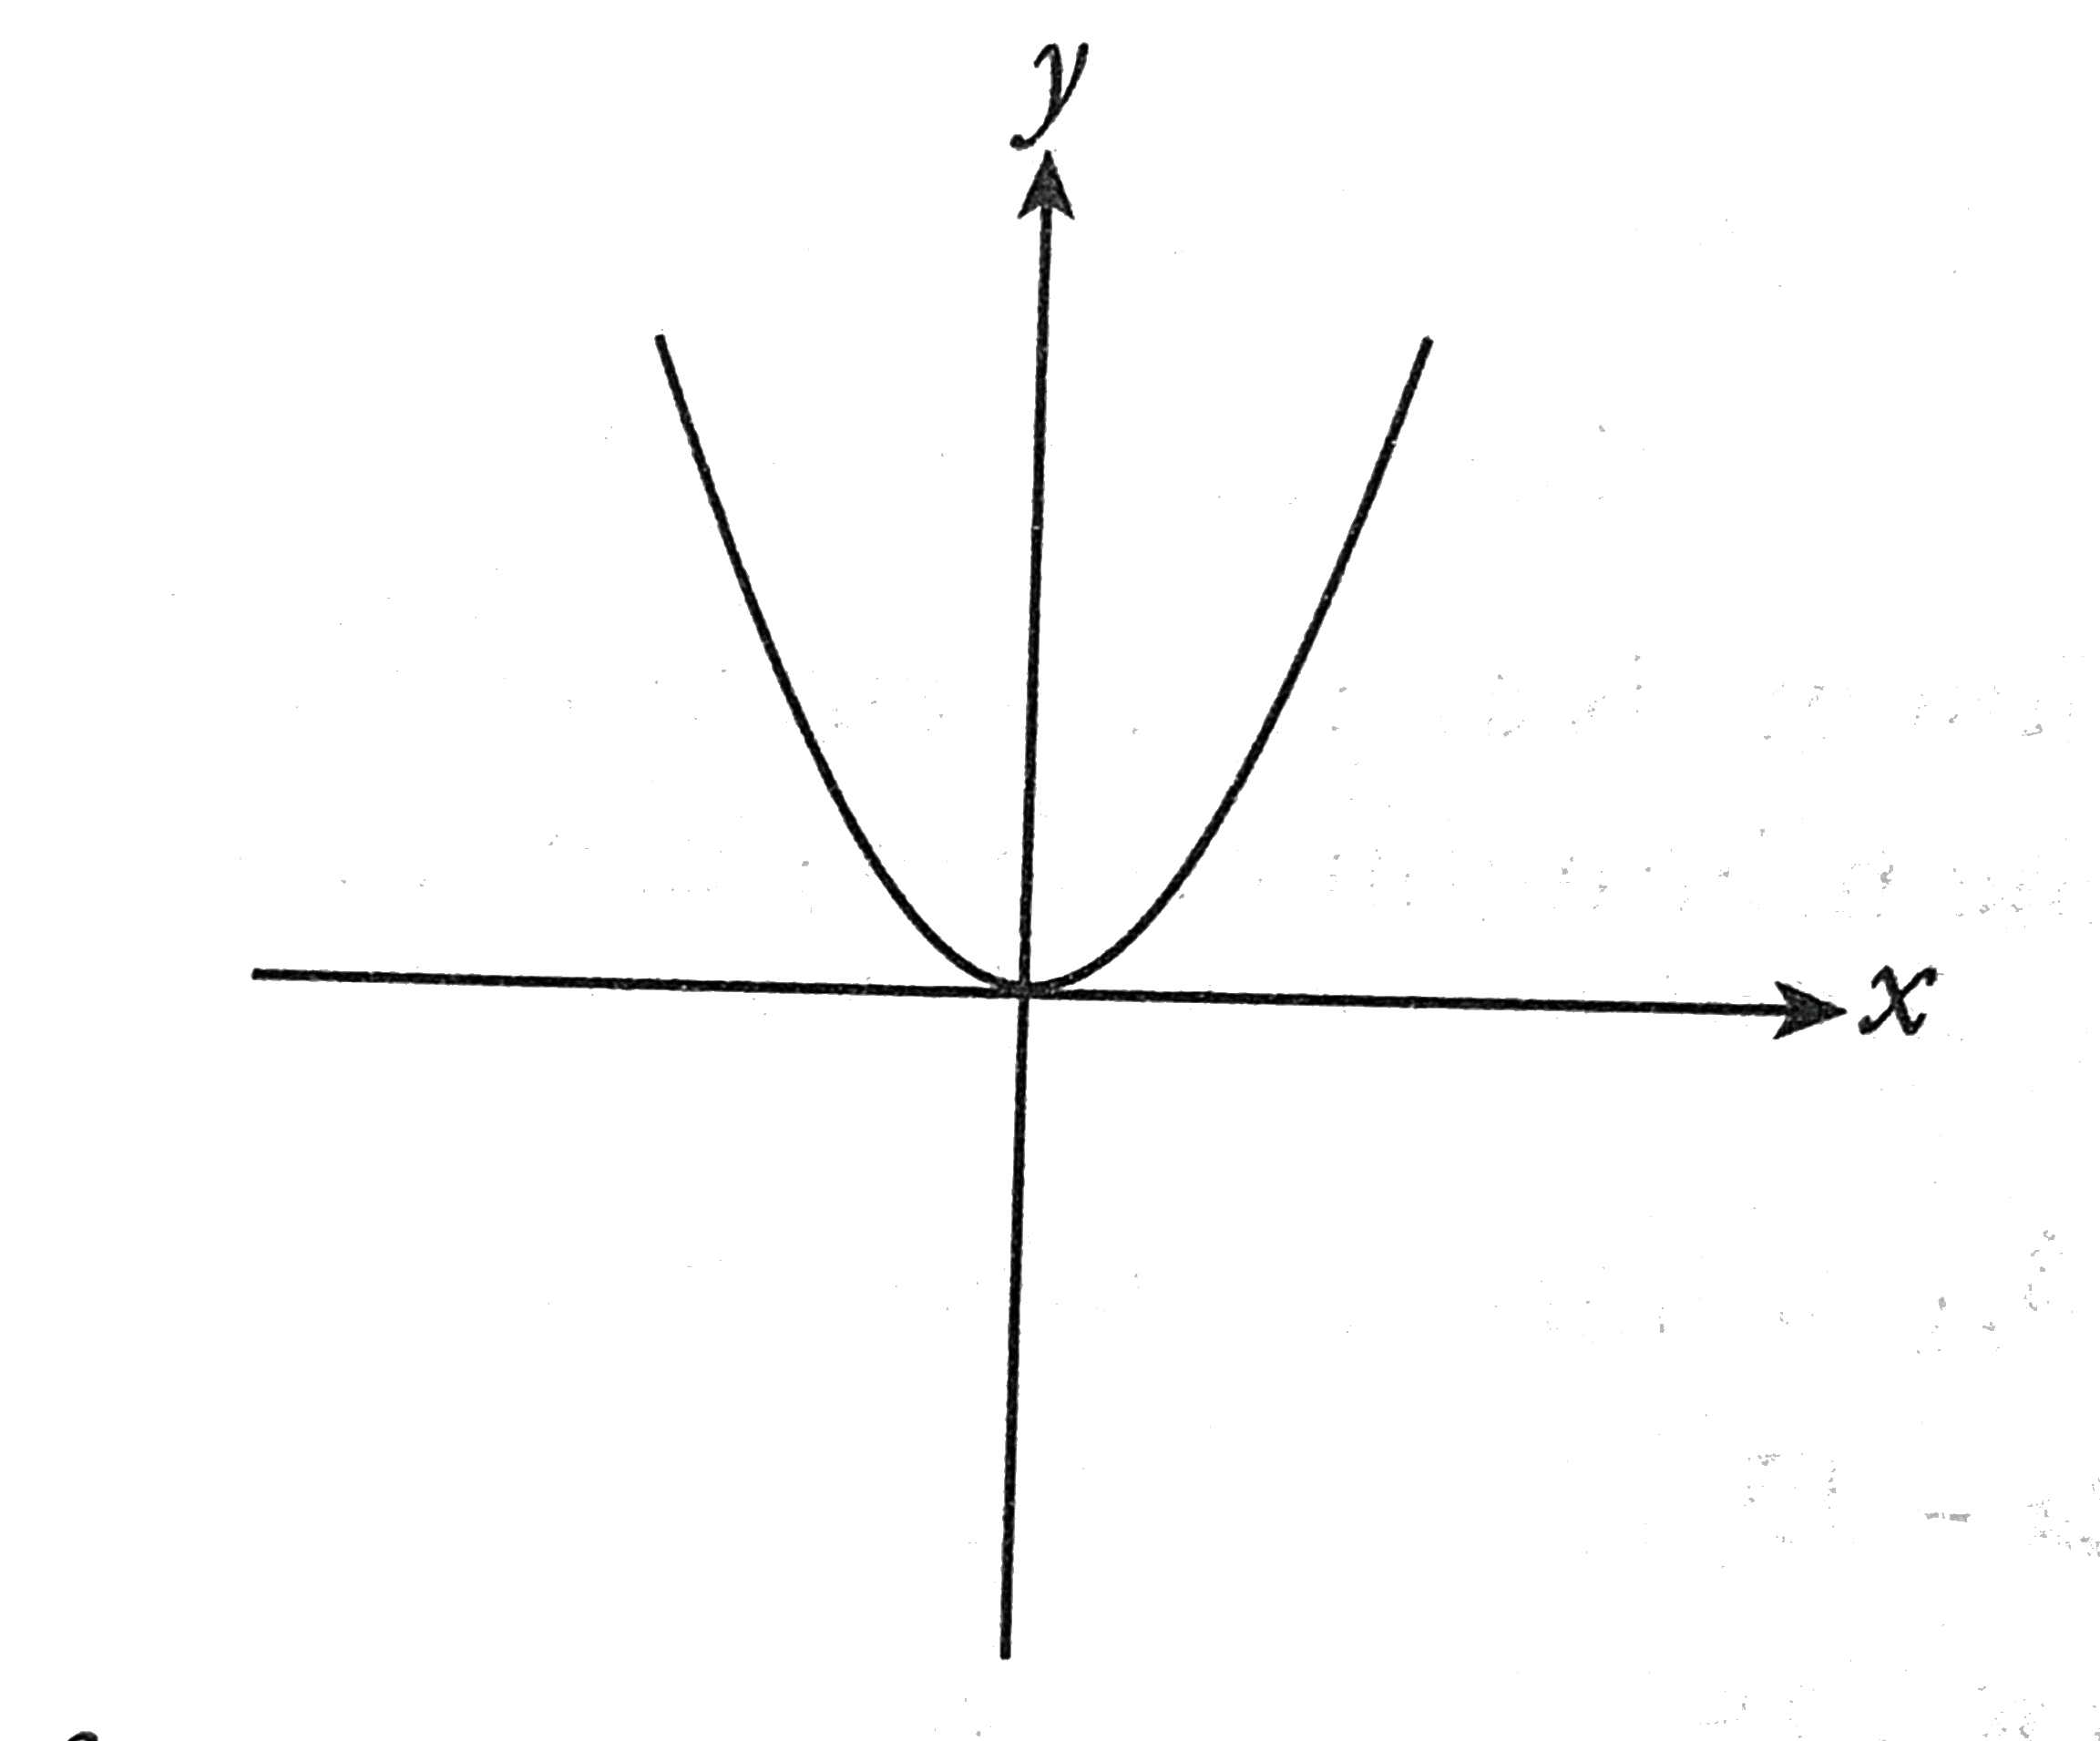
The quadratic `y=f(x)` is shown above. Which of the following graphs represents the function `y=f(x+3)-4`?
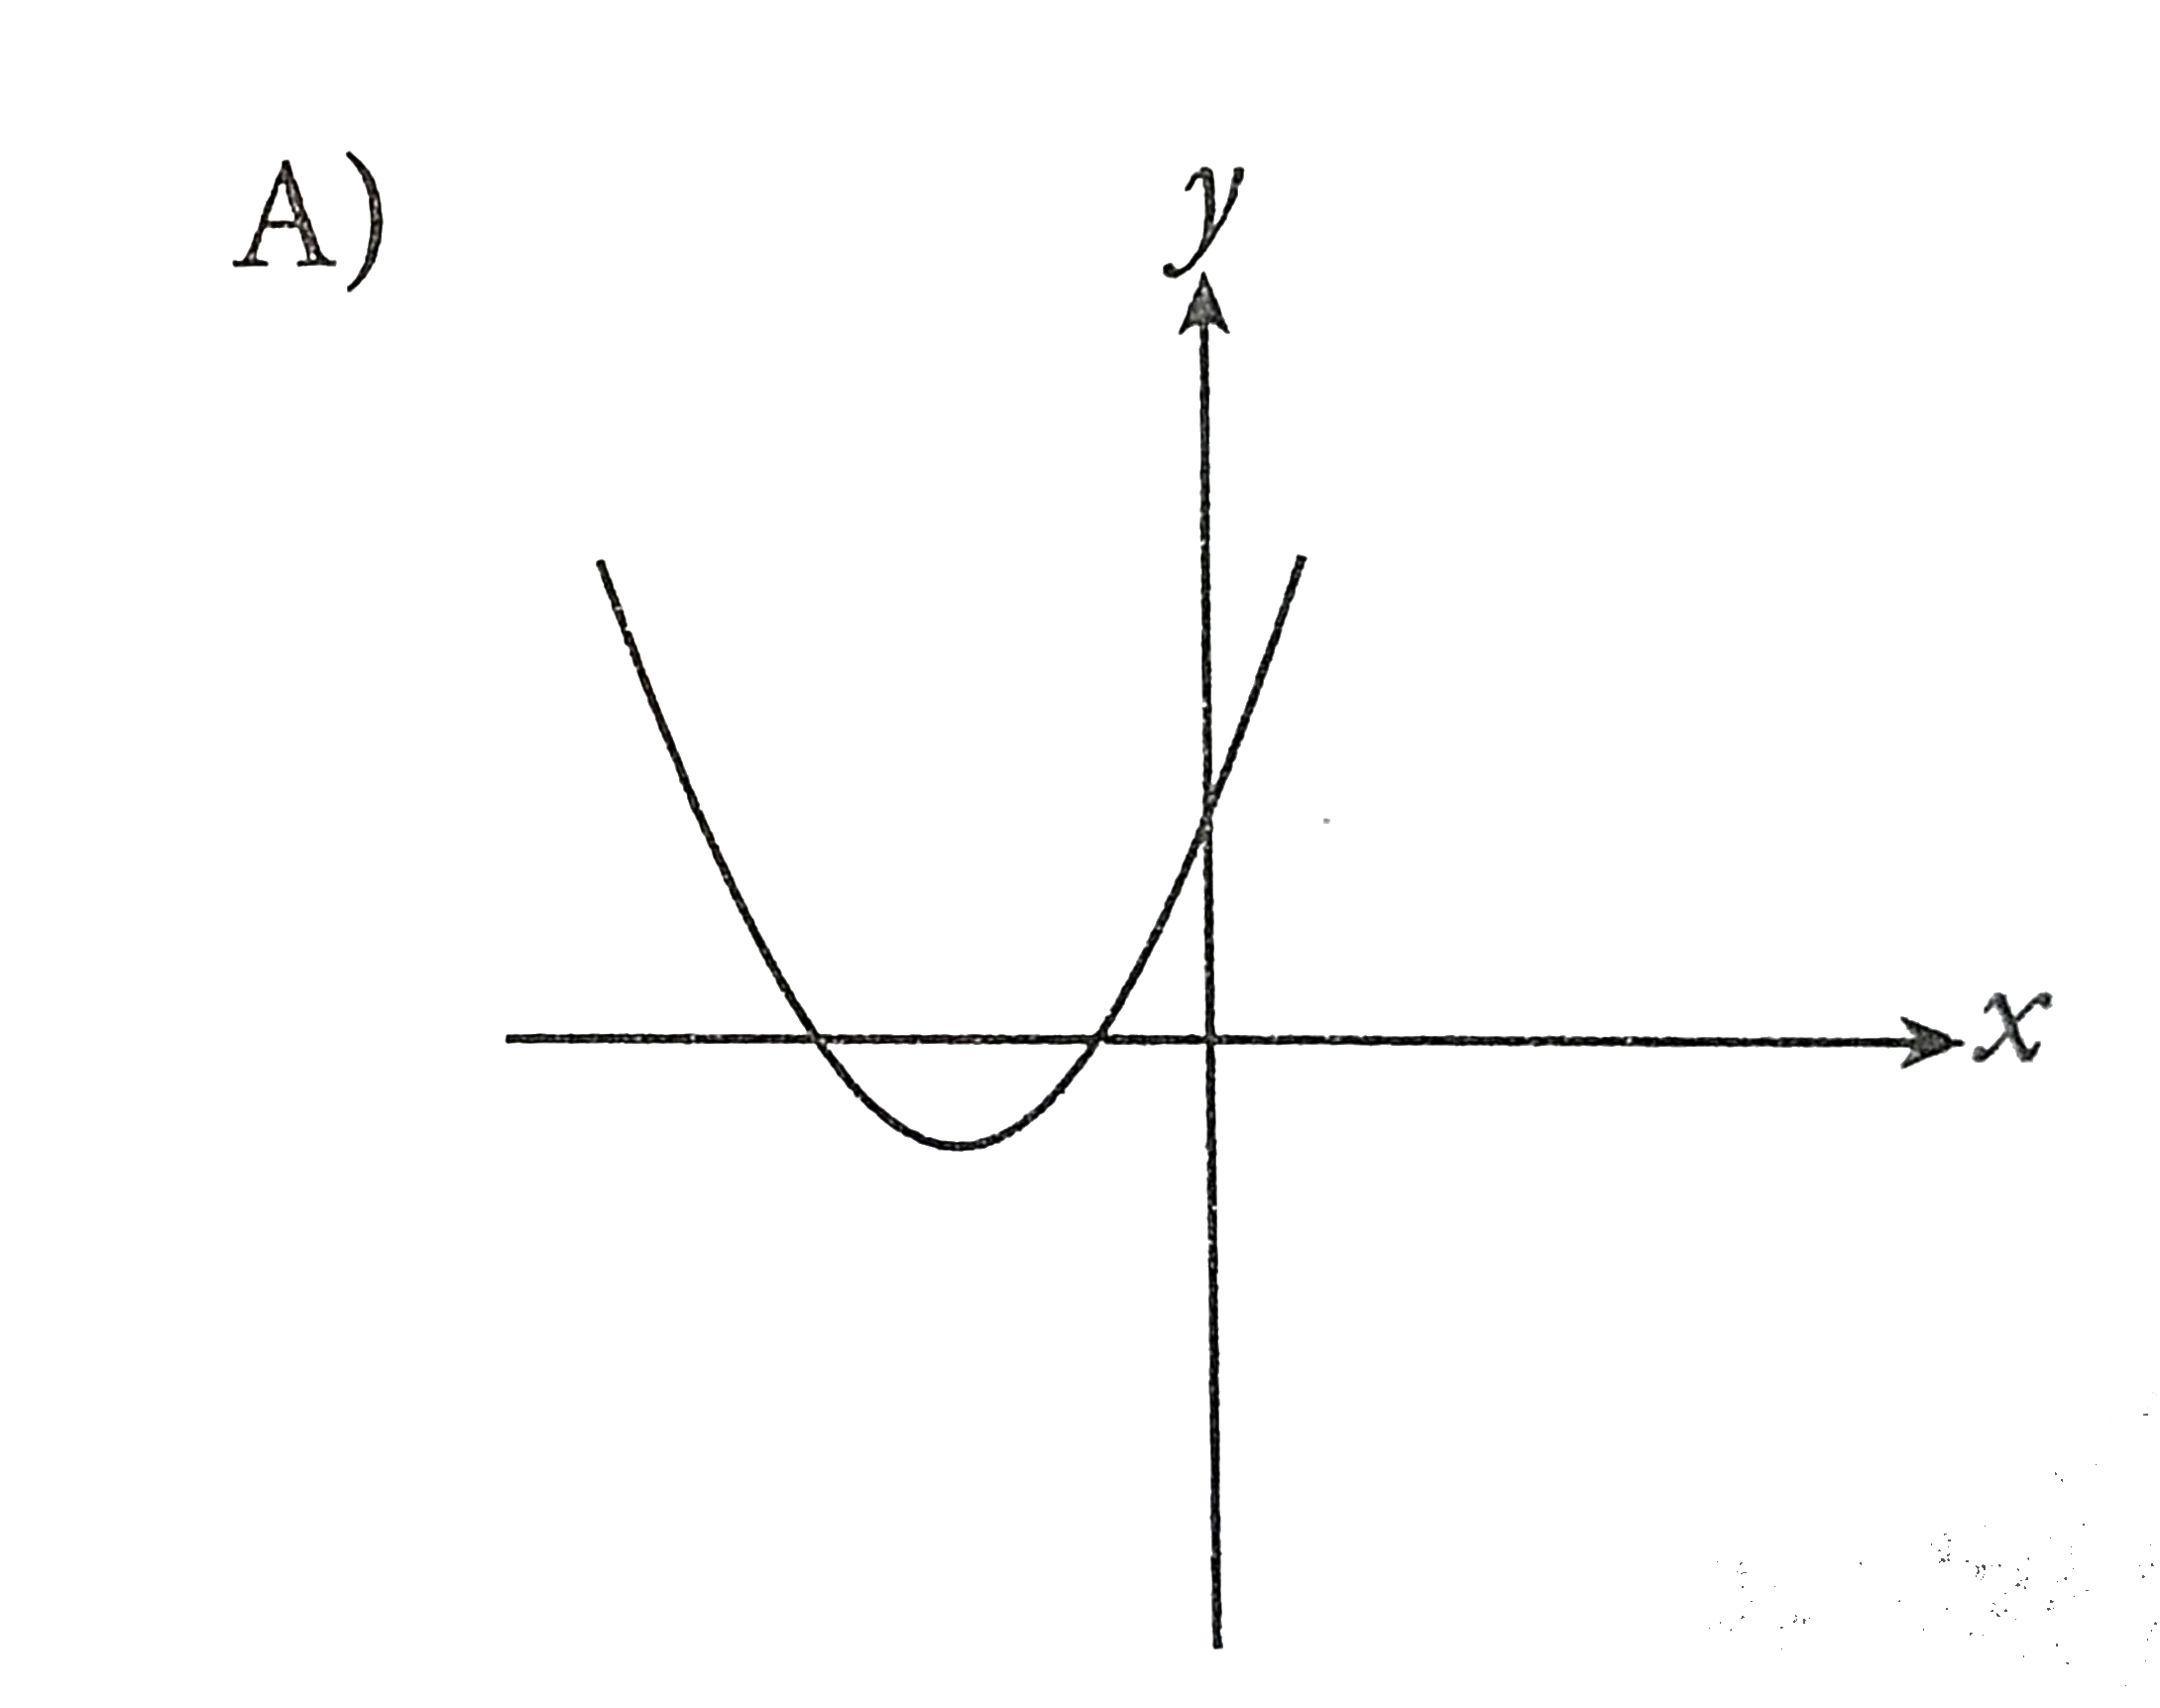
A
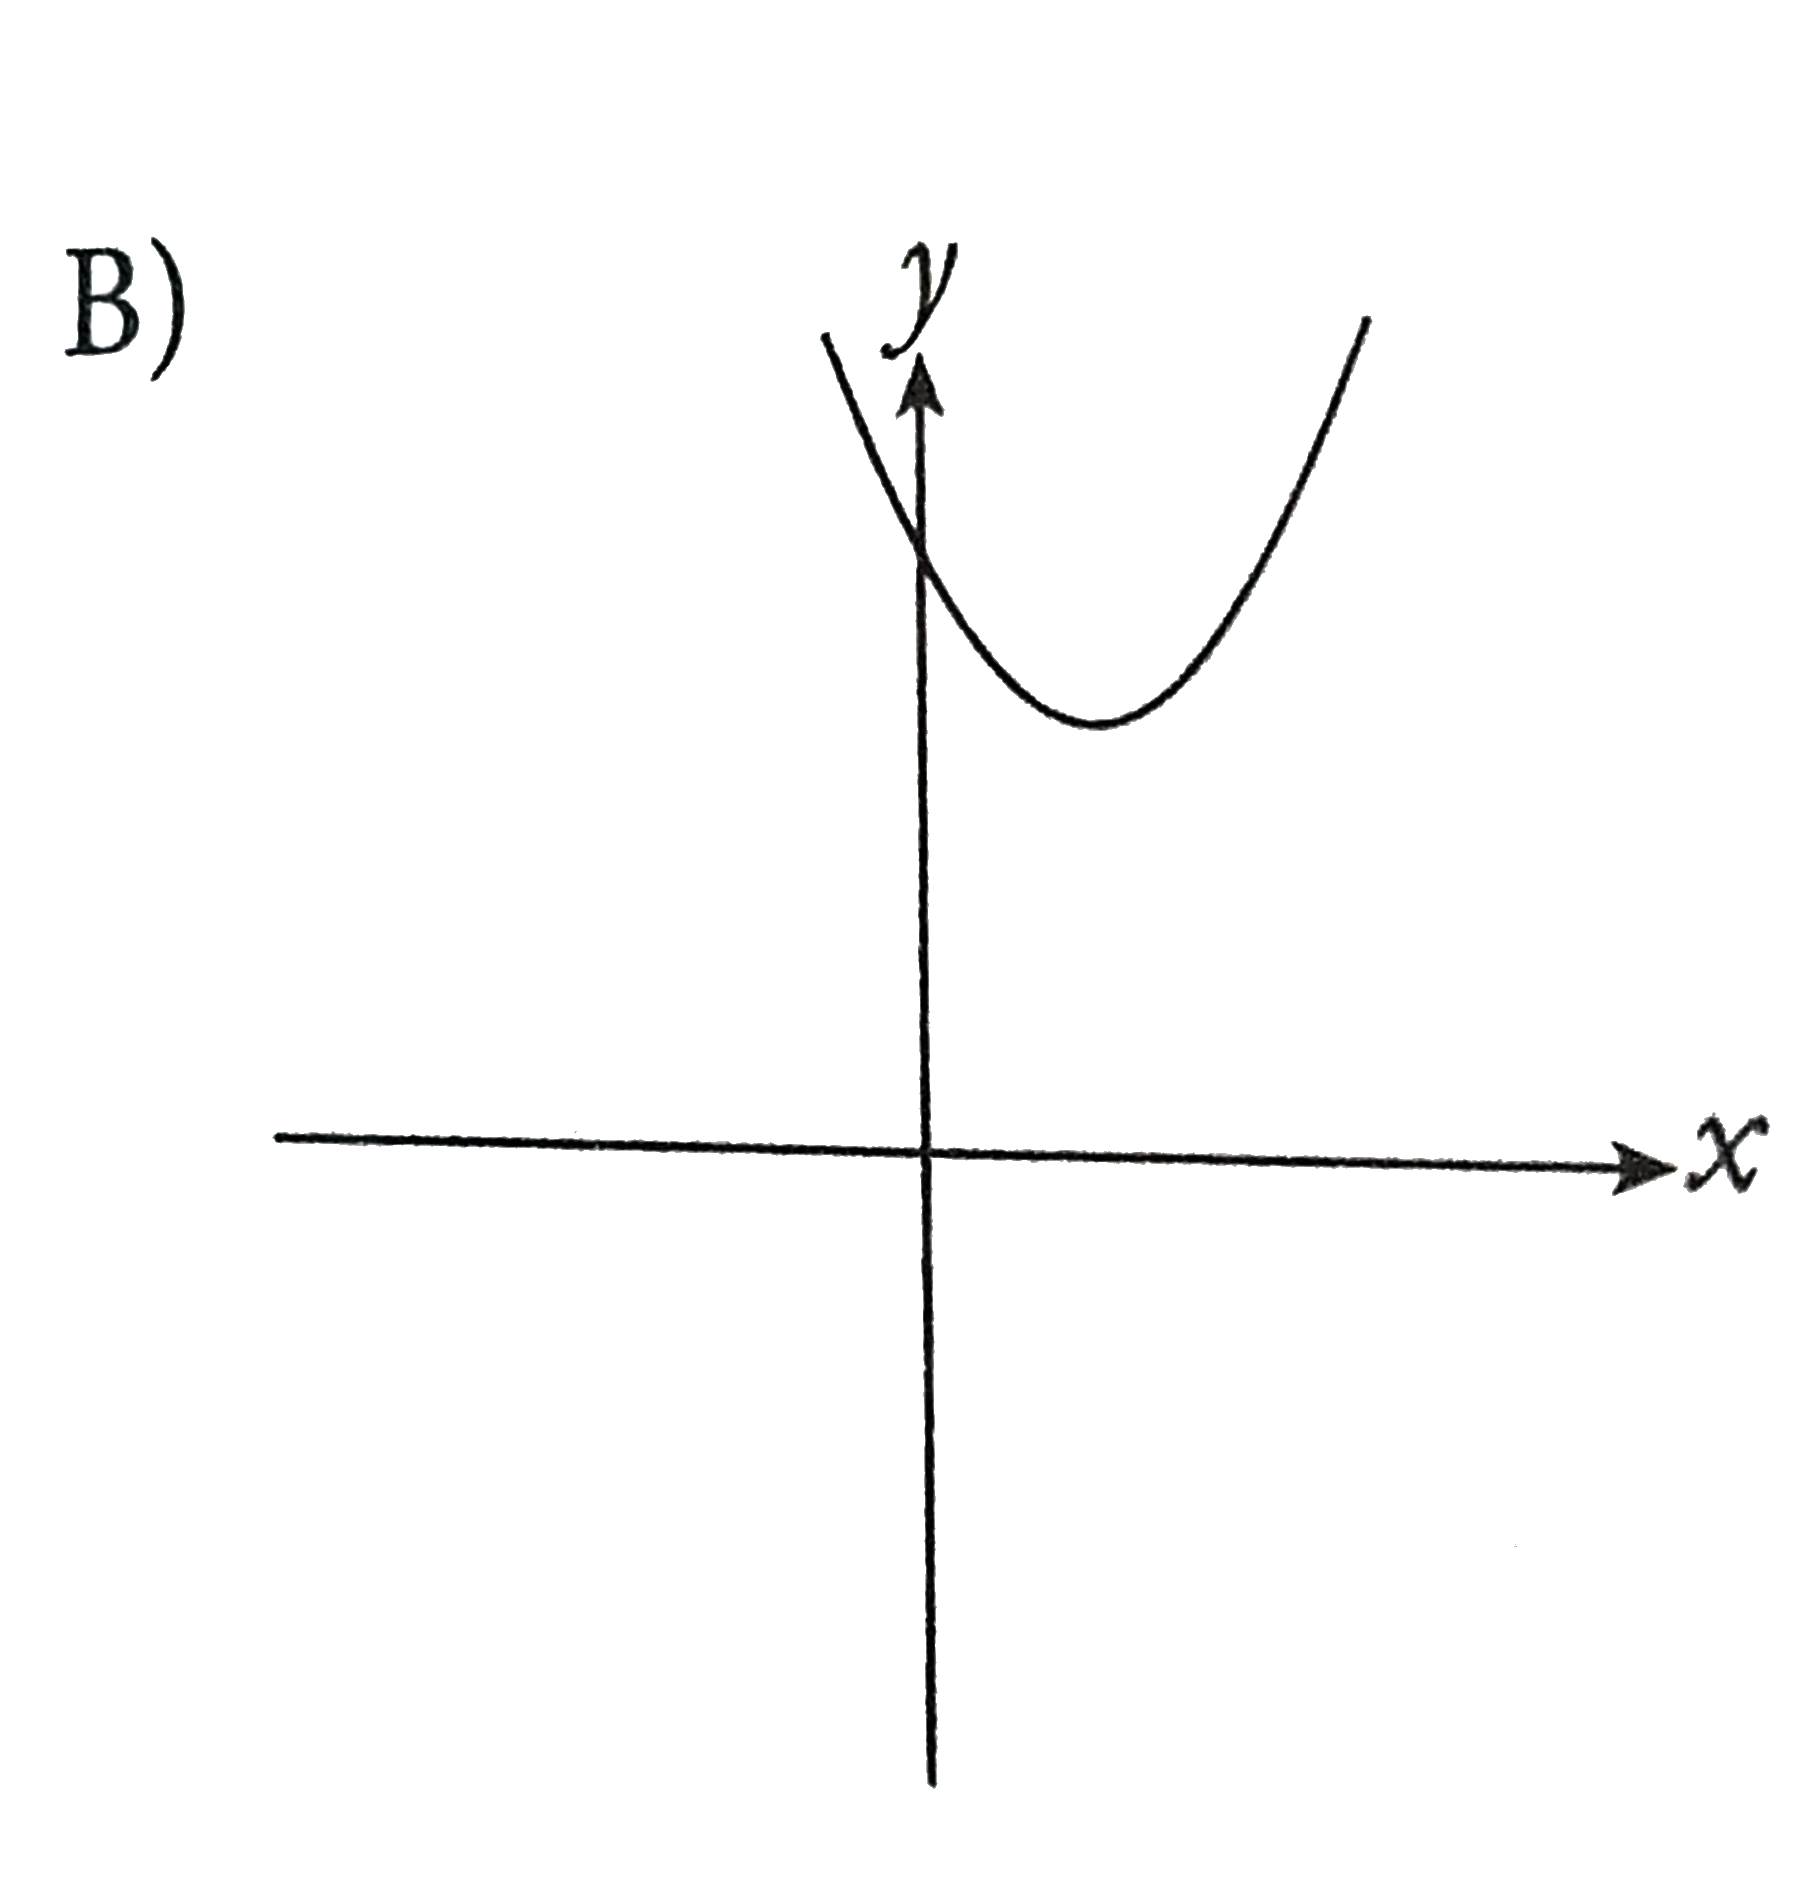
B
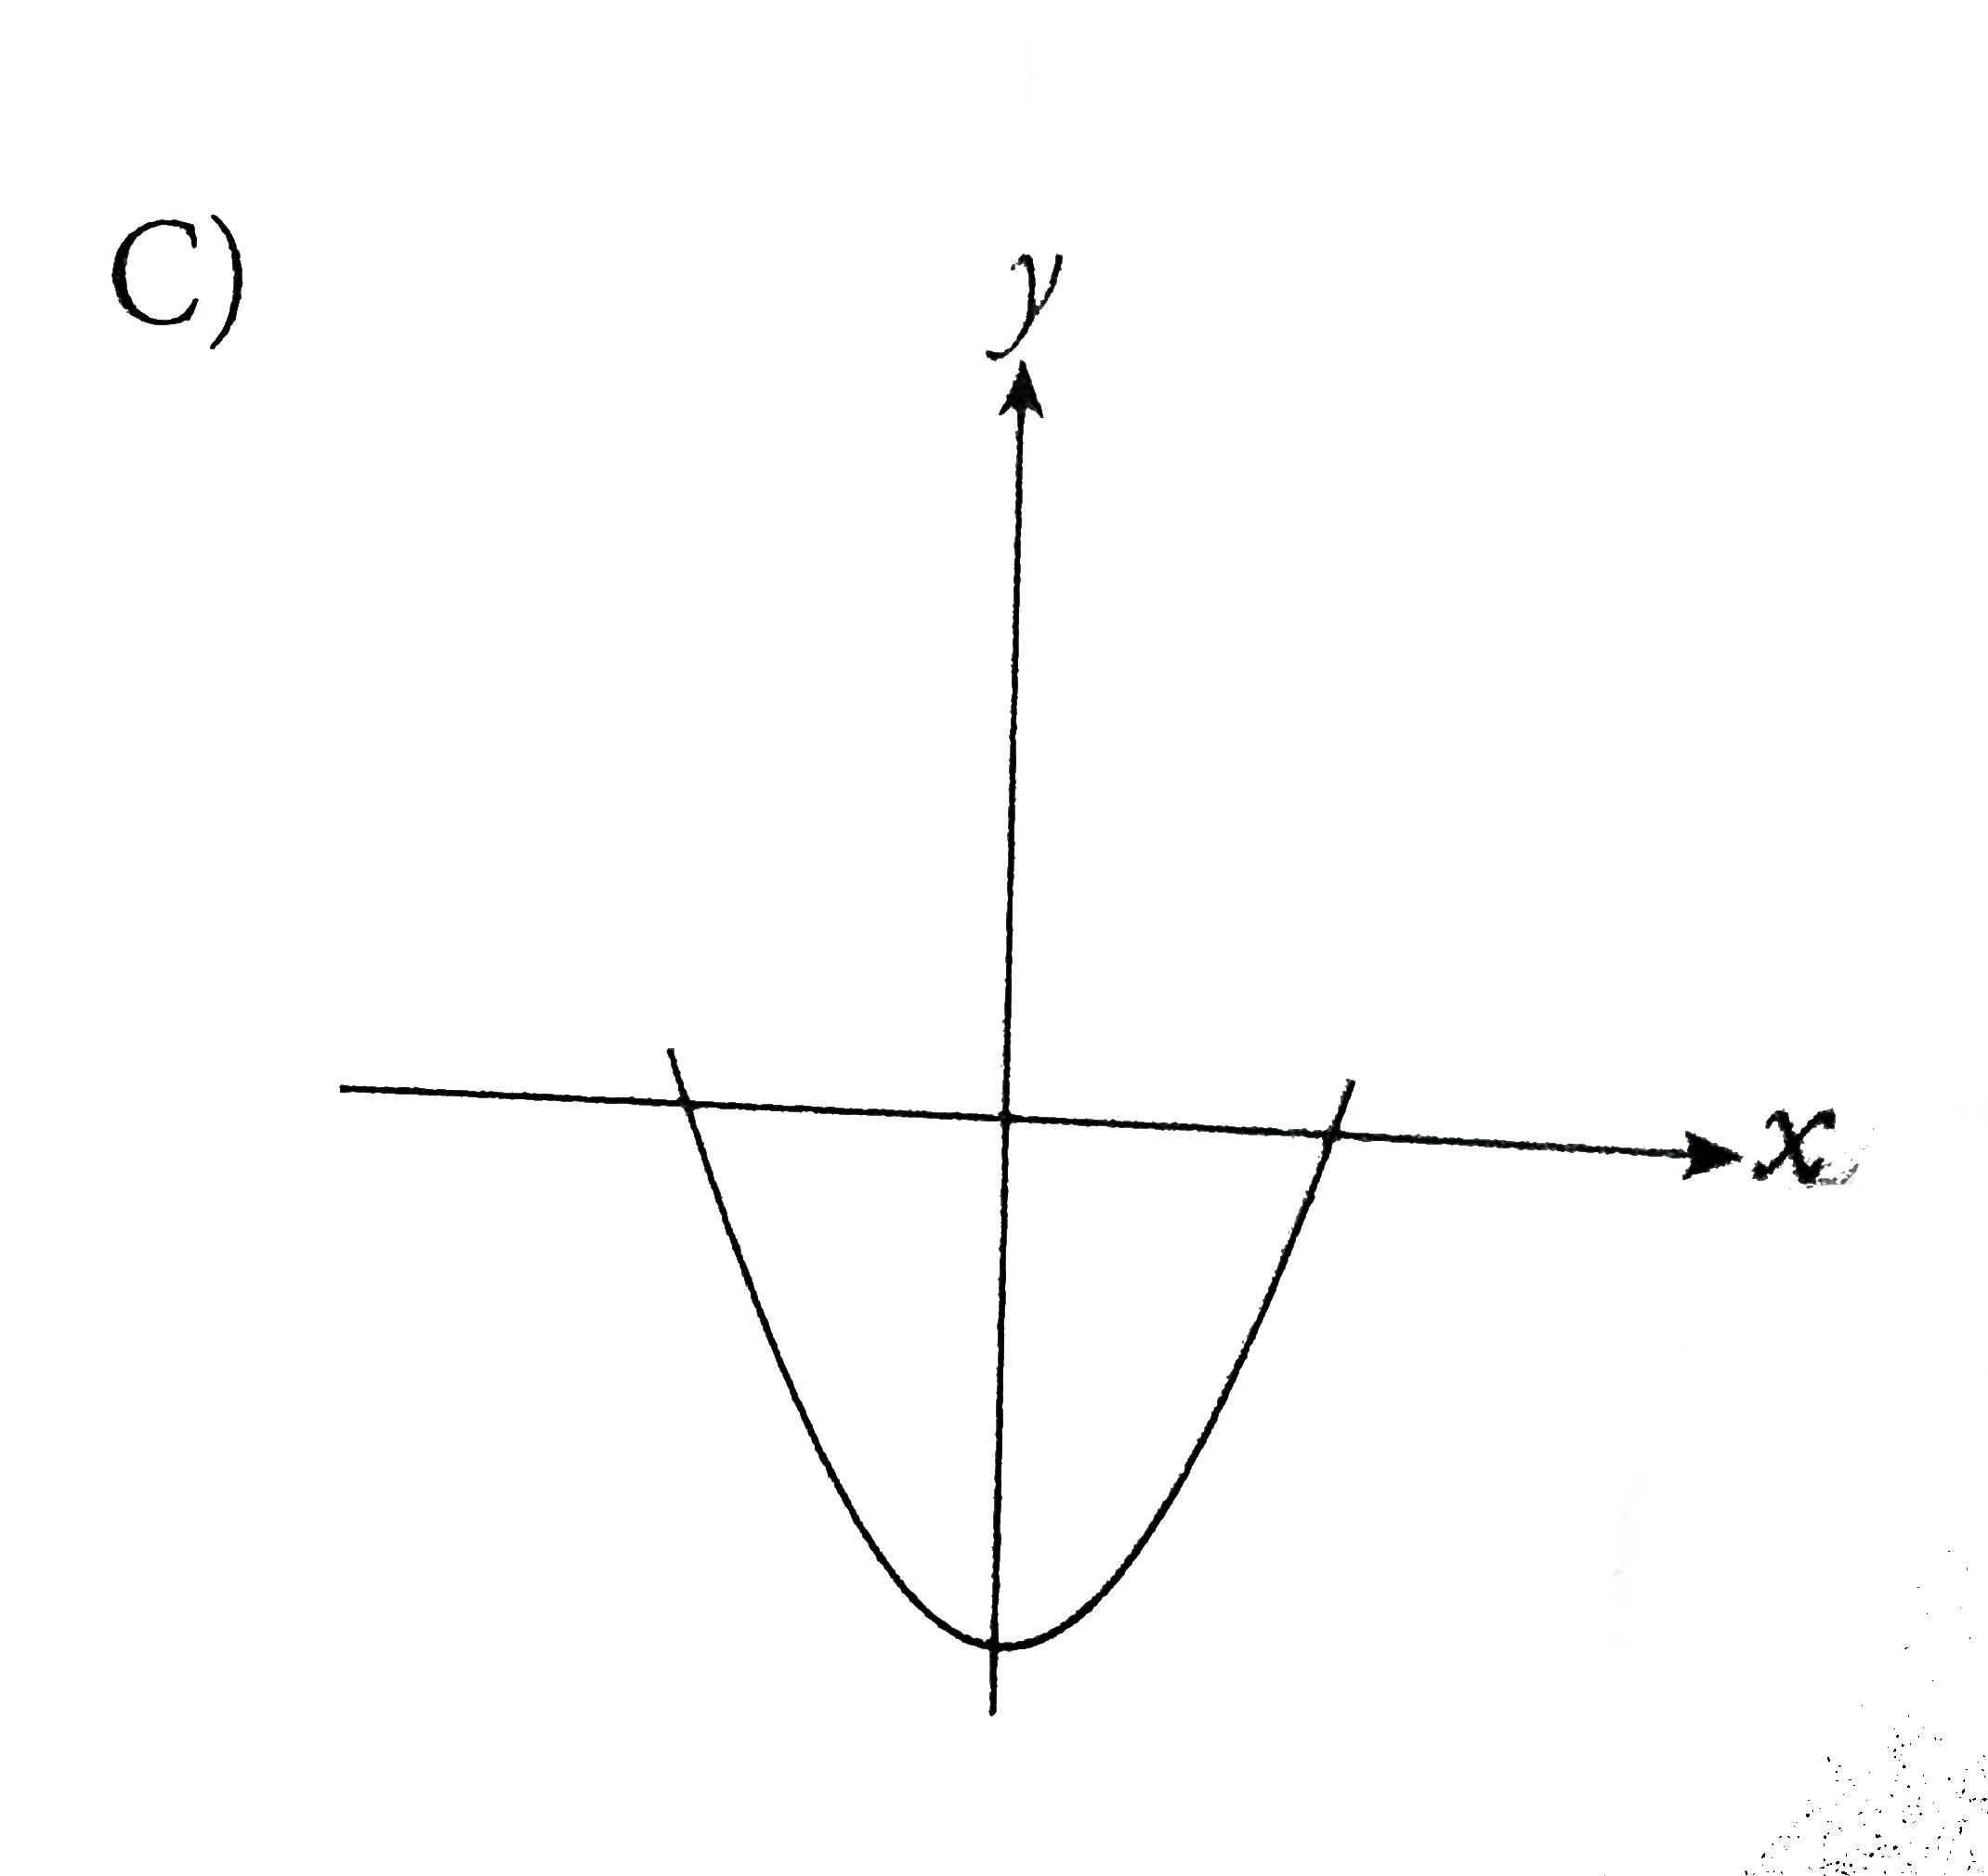
C
D
Text Solution
Verified by Experts
The correct Answer is:
A
Topper's Solved these Questions
ADDITIONAL TOPICS
PRINCETON|Exercise QUICK QUIZ #8|3 Videos
ADVANCED ARITHMETIC
PRINCETON|Exercise Examples|25 Videos
Similar Questions
Explore conceptually related problems
The graph of y=f(x) is shown below. Which of the following could represents the graph of y=f(x-2)+1 ?
The graph of f(x) is shown above , Which of the following represents the graph of f(x-3) ?
The graph of the function f is shown above. Which of the following could represent the graph of y=|f(x)| ?
The graph above shows y=2x. Which of the following graphs represents y=|2x| ?
The graph of the function y =f(x) . Then which of the following curve represent the graph of the function y= |f(x)|
A function f(x) is defined as even if and only if f(x) = f(-x) for all real values of x. Which one of the following graphs represents an even function f(x) ?
In the figure above, of y=f(x) is shown. Which of the following could be the equation of f(x)?
The table shows the values of the quadratic functions f for several values of x. Which one of the following best represents f? {:(x,-1,0,1," "2),(f(x)," "1,3,1,-5):}
If the accomanying figure above shows the graph of function f, which of the following could represent the graph of y=f(x+1) ?