A
B
C
D
Text Solution
Verified by Experts
The correct Answer is:


Topper's Solved these Questions
PROBLEM SETS
PRINCETON|Exercise PROBLEM SET 9: EXPONENTS, ROOTS, AND EQUATIONS|11 VideosPROBLEM SETS
PRINCETON|Exercise PROBLEM SET 10: LINES, ANGLES, AND COORDINATES|11 VideosPROBLEM SETS
PRINCETON|Exercise PROBLEM SET 7: AVERAGES, RATIOS, PROPORTIONS, AND PROBABILITIES|11 VideosPRACTICE TEST 4
PRINCETON|Exercise Math Test-Calculator|38 VideosSAT MATH: THE BIG PICTURE
PRINCETON|Exercise Example|4 Videos
Similar Questions
Explore conceptually related problems
PRINCETON-PROBLEM SETS-PROBLEM SET 8 CHARTS AND DATA
- The Chart above shows the original and sale prices of a certain item a...
Text Solution
|
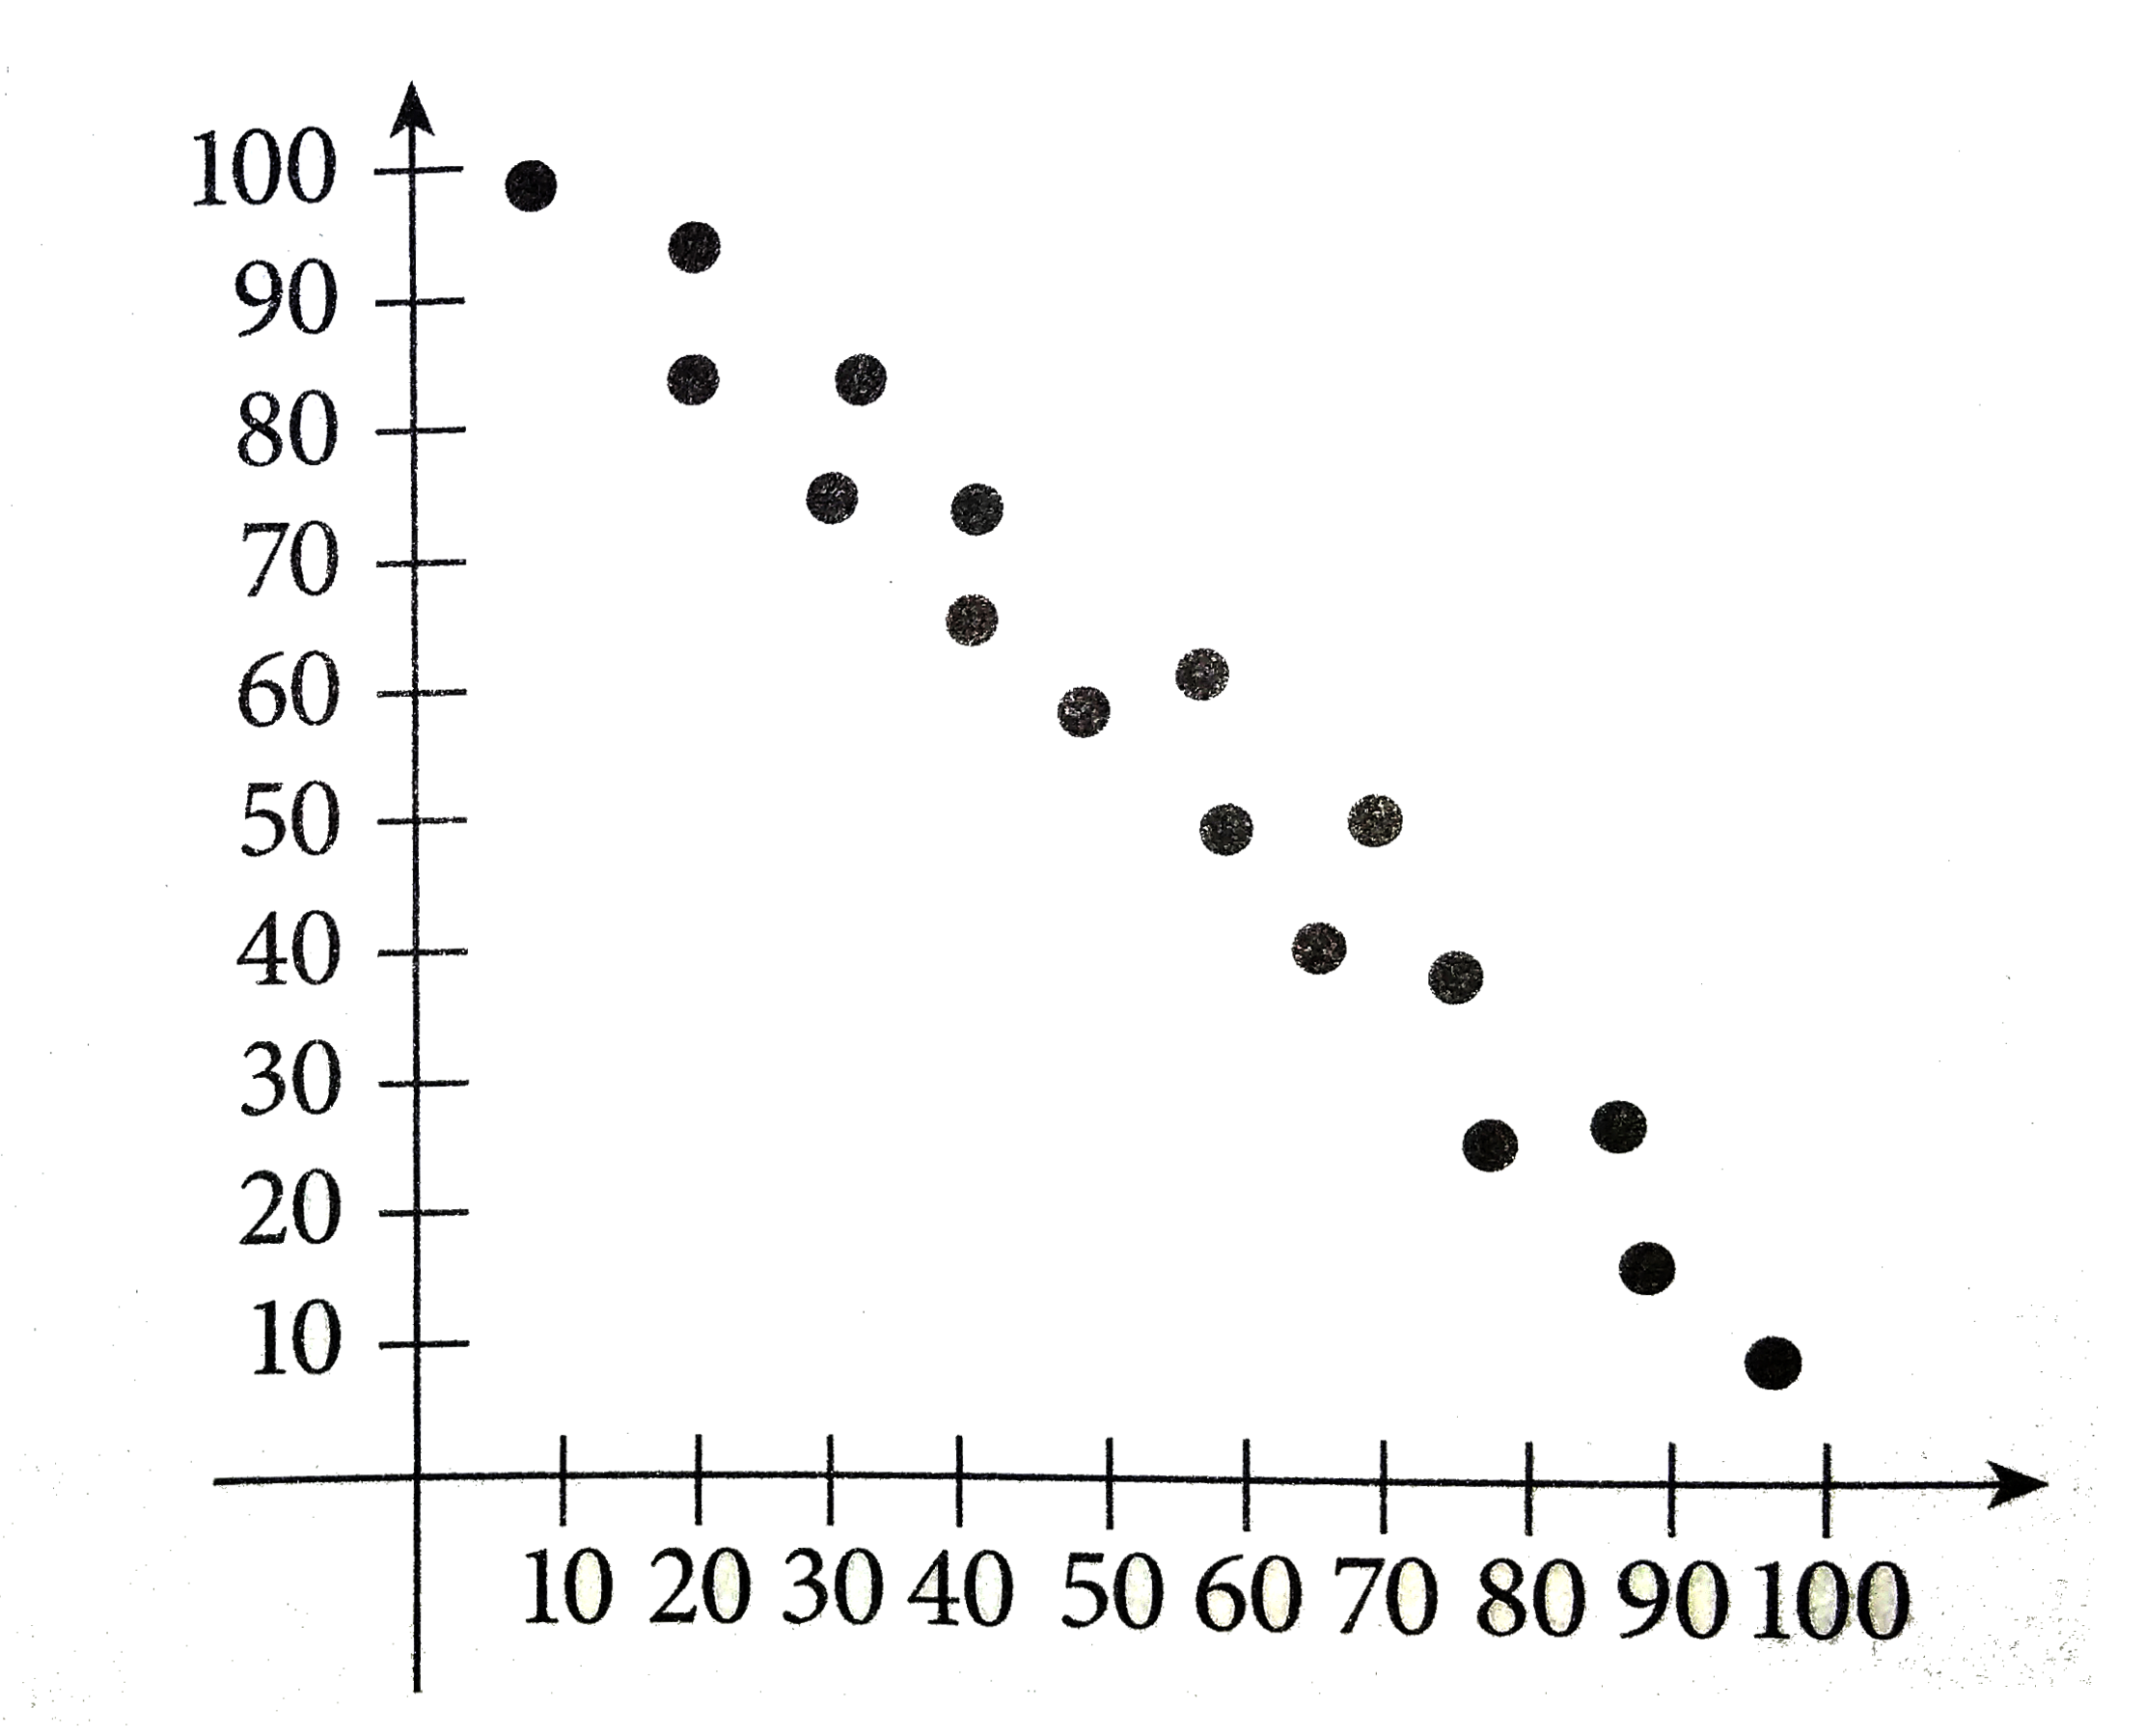
- Which of the following is most likely the slope of the line of best fi...
Text Solution
|
- The table above shows the result of a random survey of 500 men and wom...
Text Solution
|
- The table above shows the result of a random survey of 500 men and wom...
Text Solution
|
- The table above shows the population growth of certain bacteria over f...
Text Solution
|
- A coffee distributes randomly polled 200 employees from each of two co...
Text Solution
|
- A coffee distributes randomly polled 200 employees from each of two co...
Text Solution
|
- A coffee distributes randomly polled 200 employees from each of two co...
Text Solution
|
- The scatterplot above shows the price, in dollars, for both cheese piz...
Text Solution
|
- The scatterplot above shows the daily profit made by a school store fr...
Text Solution
|
- In a given school week the average daily temperature is 20^(@)F on Mon...
Text Solution
|