Text Solution
Verified by Experts
The correct Answer is:


Topper's Solved these Questions
PROBLEM SETS
PRINCETON|Exercise PROBLEM SET 16: MORE GRID-INS|11 VideosPROBLEM SETS
PRINCETON|Exercise PROBLEM SET 17: MIXED BAG|11 VideosPROBLEM SETS
PRINCETON|Exercise PROBLEM SET 14: FUNCTIONS|11 VideosPRACTICE TEST 4
PRINCETON|Exercise Math Test-Calculator|38 VideosSAT MATH: THE BIG PICTURE
PRINCETON|Exercise Example|4 Videos
Similar Questions
Explore conceptually related problems
PRINCETON-PROBLEM SETS-PROBLEM SET 15: GRID-INS
- If x-y=-6, then y is how much greater than x?
Text Solution
|
- In the figure above, what is the value of x?
Text Solution
|
- A certain solution requires 3(1)/(2) grams of additive for each 7 lite...
Text Solution
|
- If ((x+2)/(y+2))=(3)/(4), then what is the value of ((2+y)/(2+x))^(2)?
Text Solution
|
- The speed, in miles per hour, of a particular experimental spacecraft ...
Text Solution
|
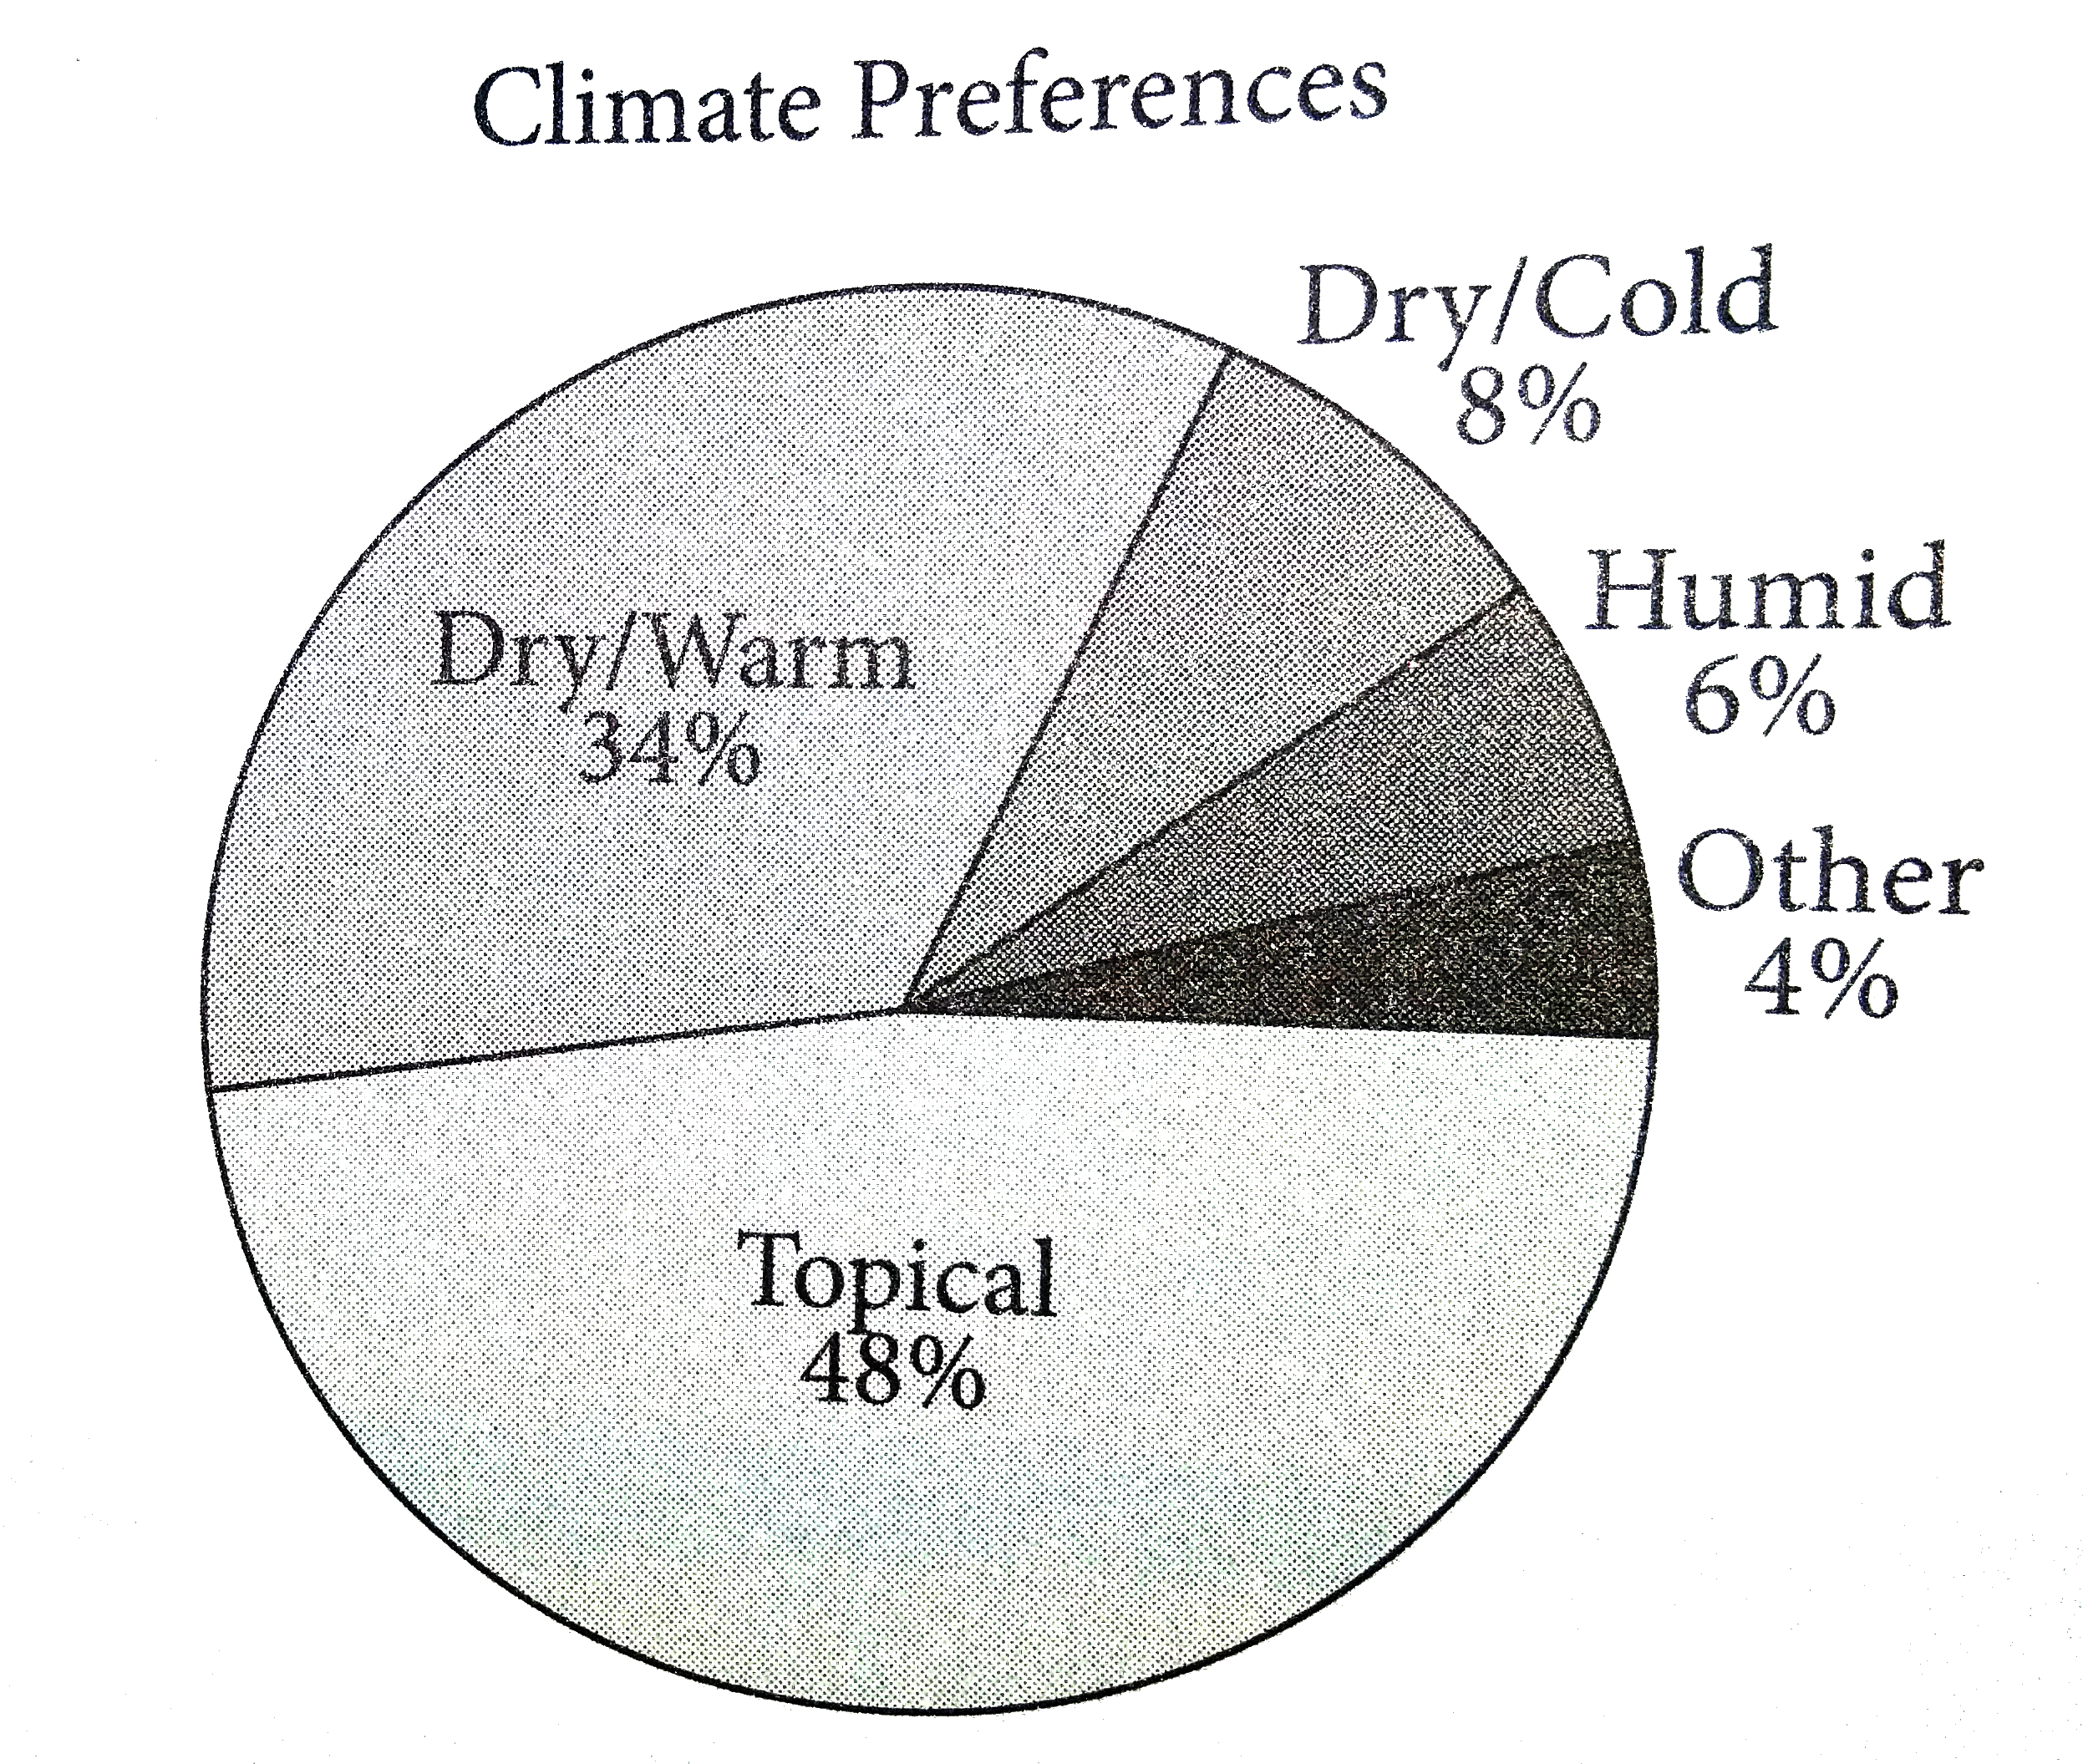
- The graph above shows the result of a survery in which adults were ask...
Text Solution
|
- Charles Lindbergh began his flight from New York to Paris on May 20, 1...
Text Solution
|
- -4, 0, 2, 3 A sequence of numbers is formed by repeating the set of ...
Text Solution
|
- In the figure below, rectangular LMNO has dimensions of 18 by 9. Segme...
Text Solution
|
- A scientist studies Bacteria Culture A, which grows then percent every...
Text Solution
|
- A scientist studies Bacteria Culture A, which grows then percent every...
Text Solution
|