A
B
C
D
Text Solution
Verified by Experts
The correct Answer is:


Topper's Solved these Questions
Similar Questions
Explore conceptually related problems
NARAYNA-THERMODYNAMICS-Passages
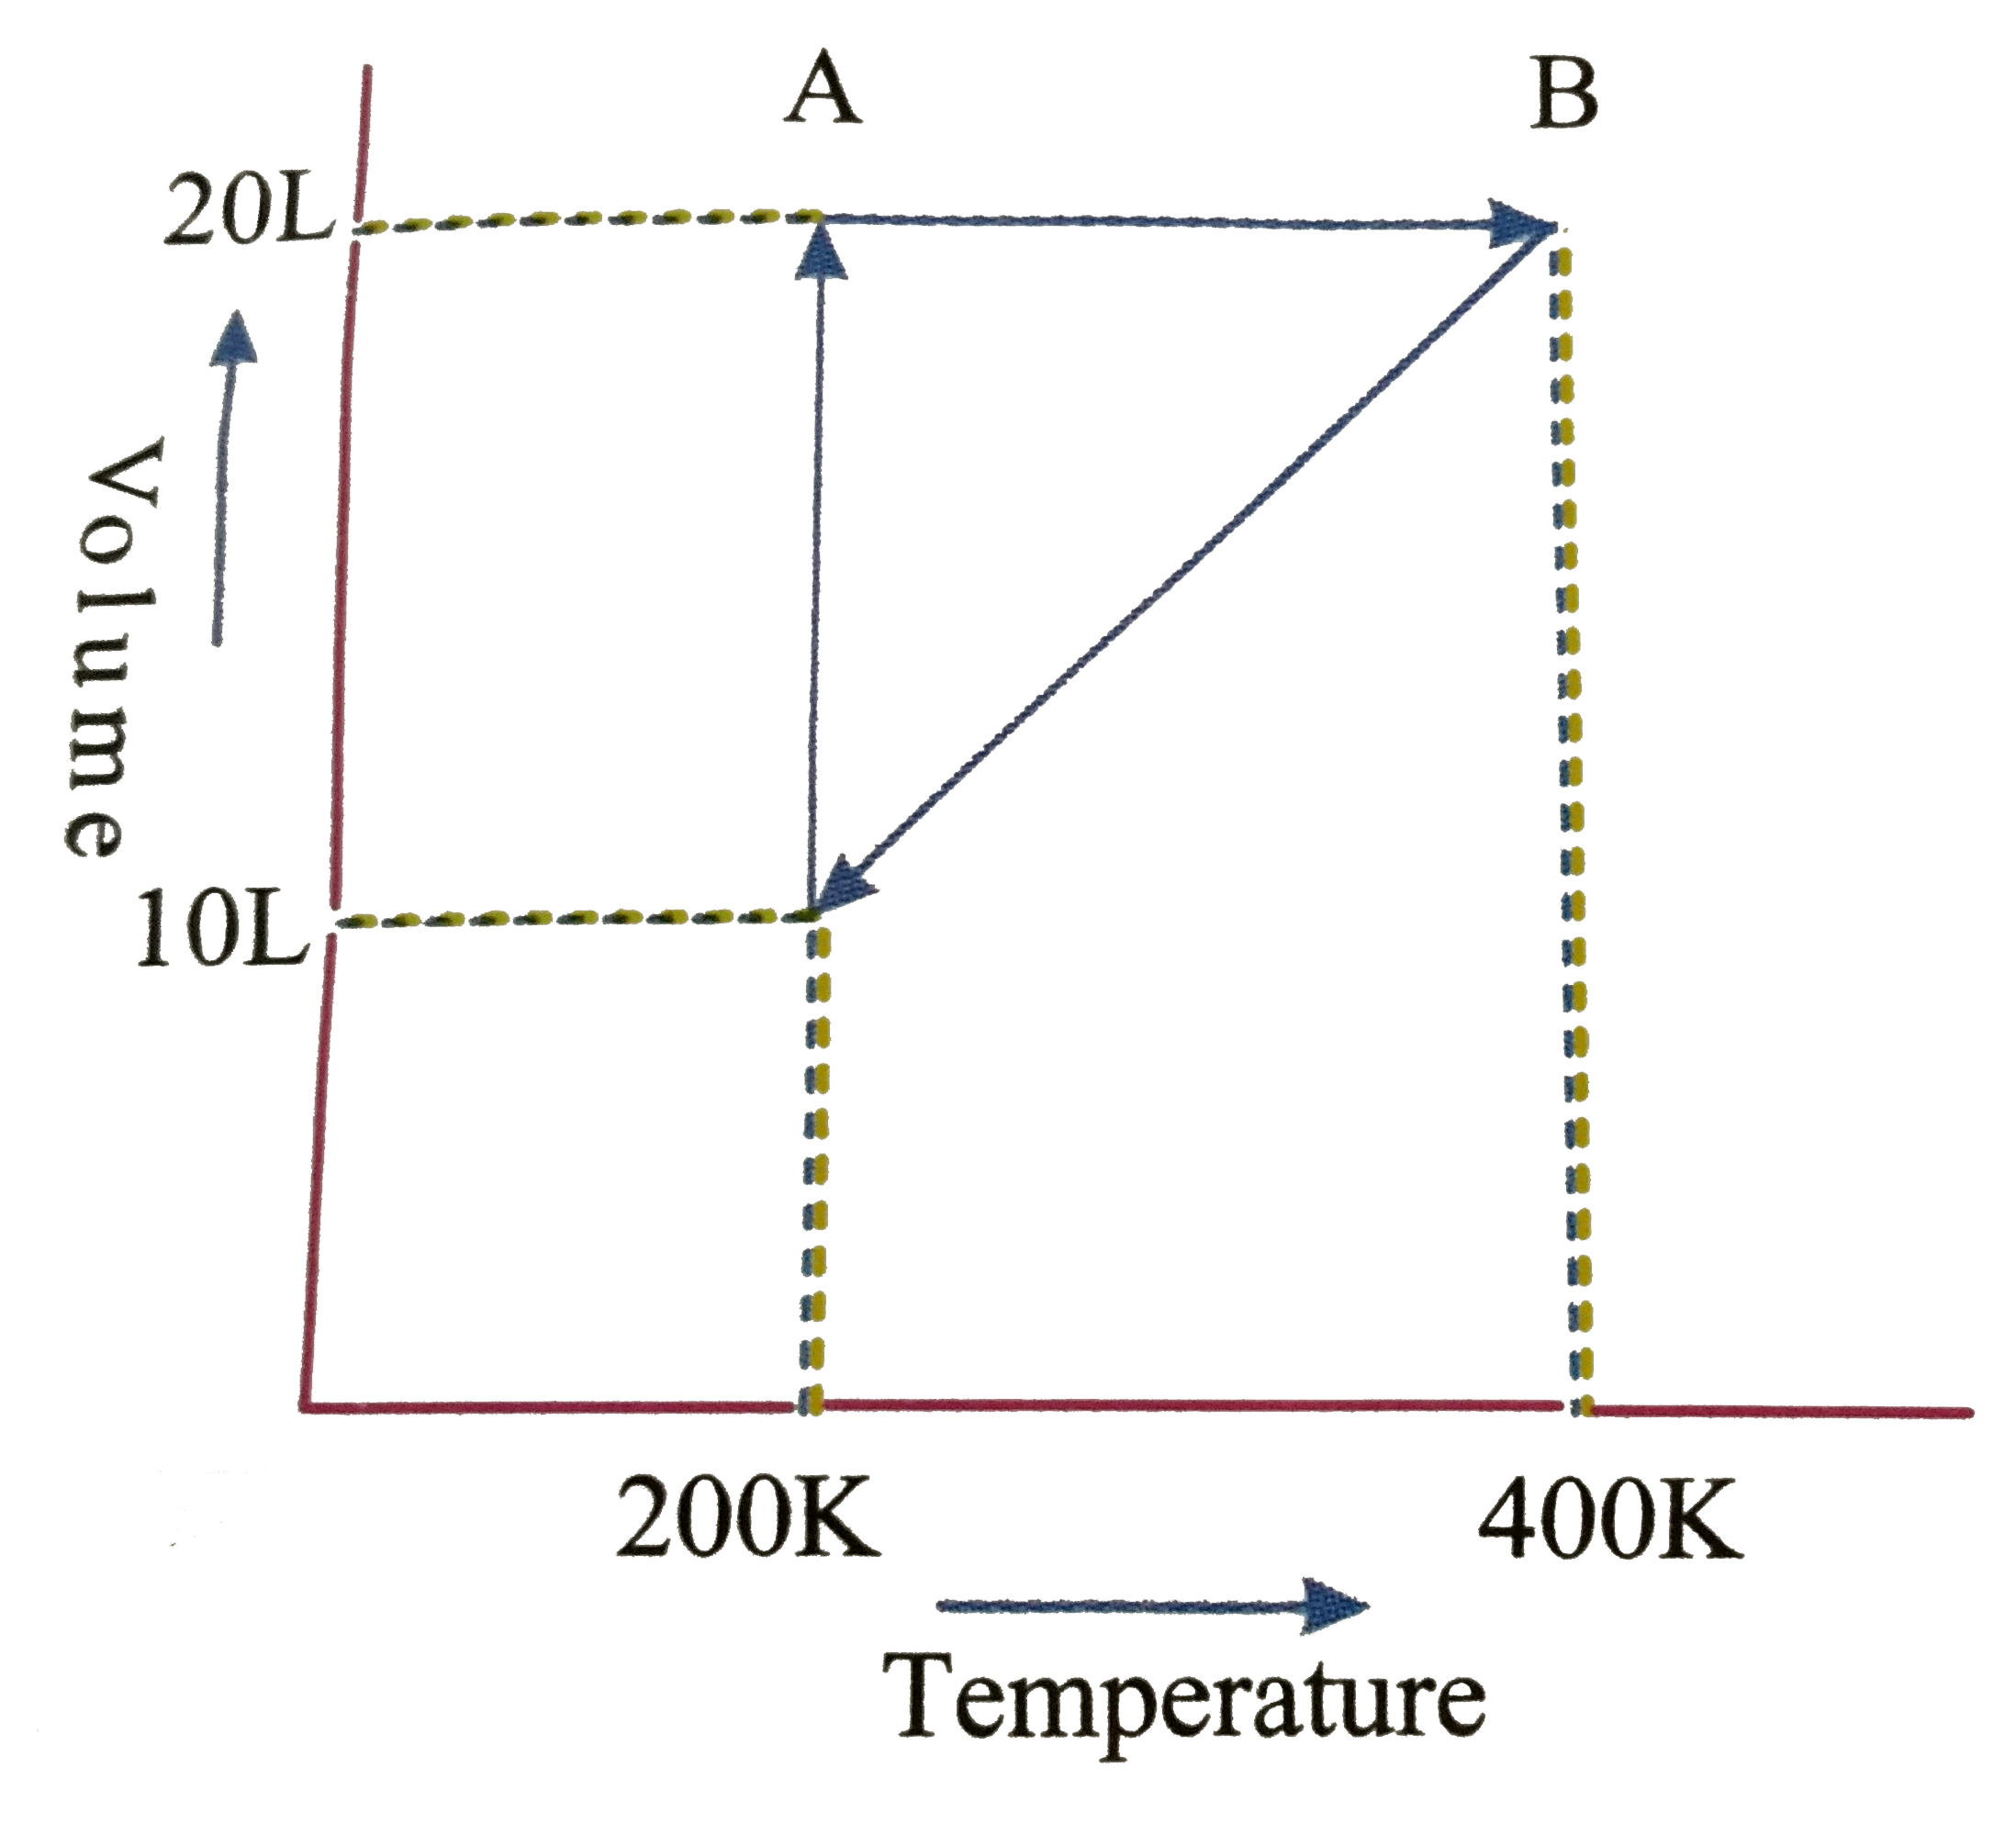
- Graph for one mole gas is given below Process, A rarr B represent...
Text Solution
|
- Graph for one mole gas is given below The pressure at C is
Text Solution
|
- Graph for one mole gas is given below Work done in the process C ...
Text Solution
|
- Graph for one mole gas is given below the process which occurs in...
Text Solution
|
- Work is the mode of transference of energy. If the system involves gas...
Text Solution
|
- Work is the mose of transfrence of energy. If the system involves gase...
Text Solution
|
- Work is the mose of transfrence of energy. If the system involves gase...
Text Solution
|
- A change in the free energy of a system at constant temperature and pr...
Text Solution
|
- DeltaG is a thermodynamic prop erty the decrease in which value is the...
Text Solution
|
- DeltaG is a thermodynamic prop erty the decrease in which value is the...
Text Solution
|
- The change in Gibbs free energy of the system alone provides a criteri...
Text Solution
|
- A change in the free energy of a system at constant temperature and pr...
Text Solution
|
- The change in Gibbs free energy of the system alone provides a criteri...
Text Solution
|