Home
Class 12
CHEMISTRY
Select the correct graphical representat...

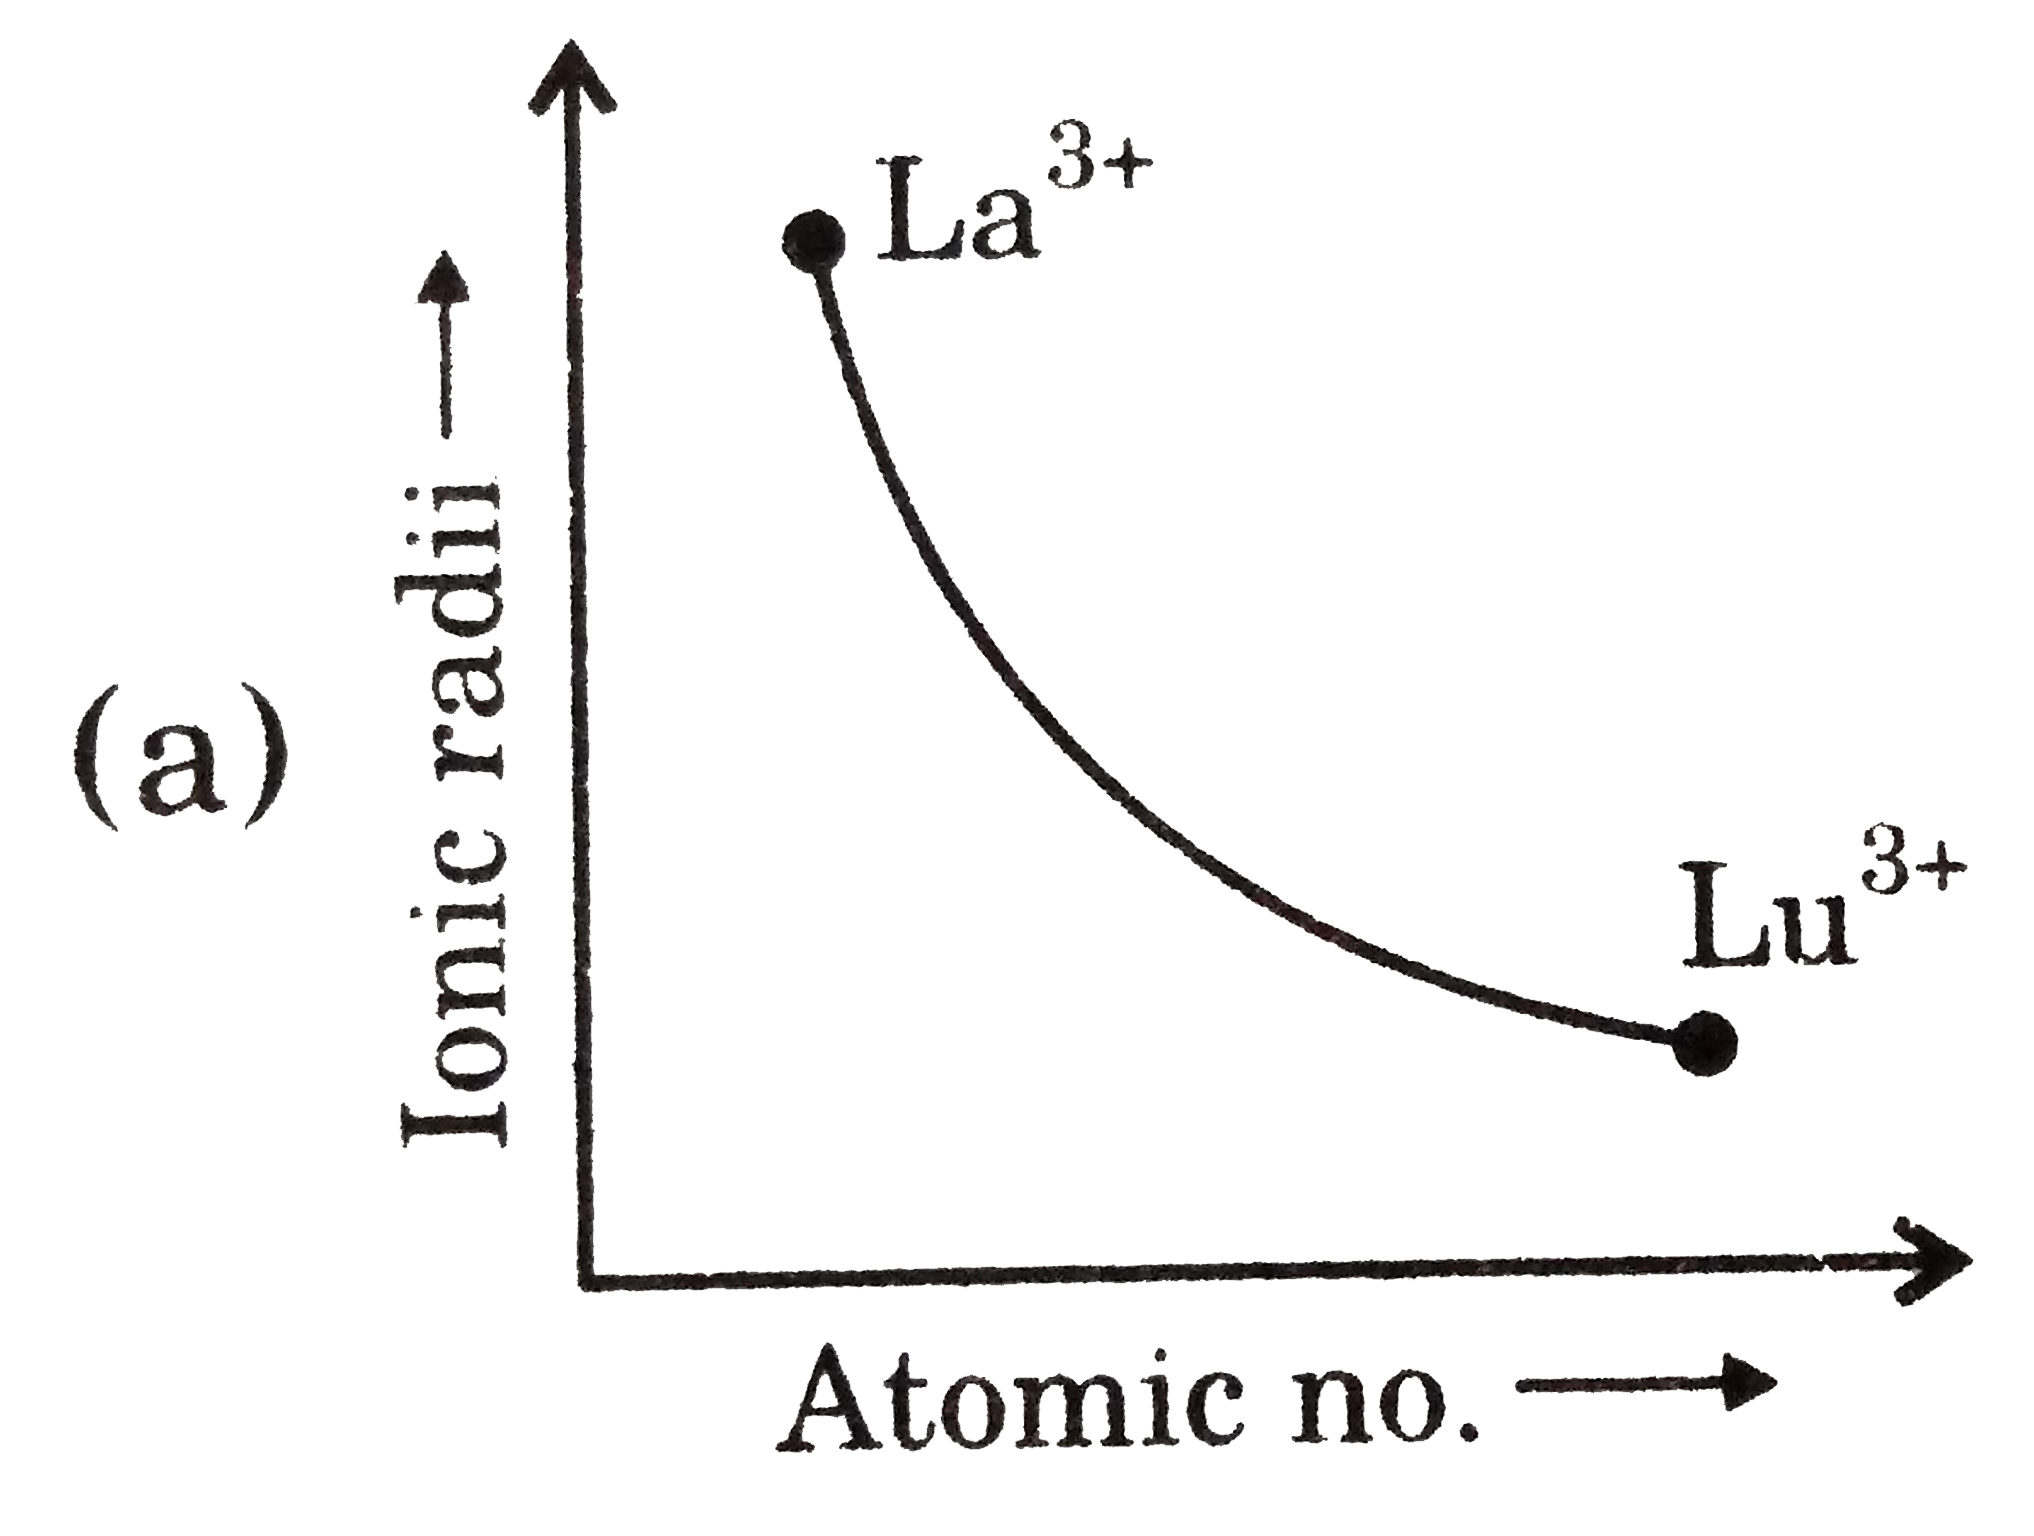
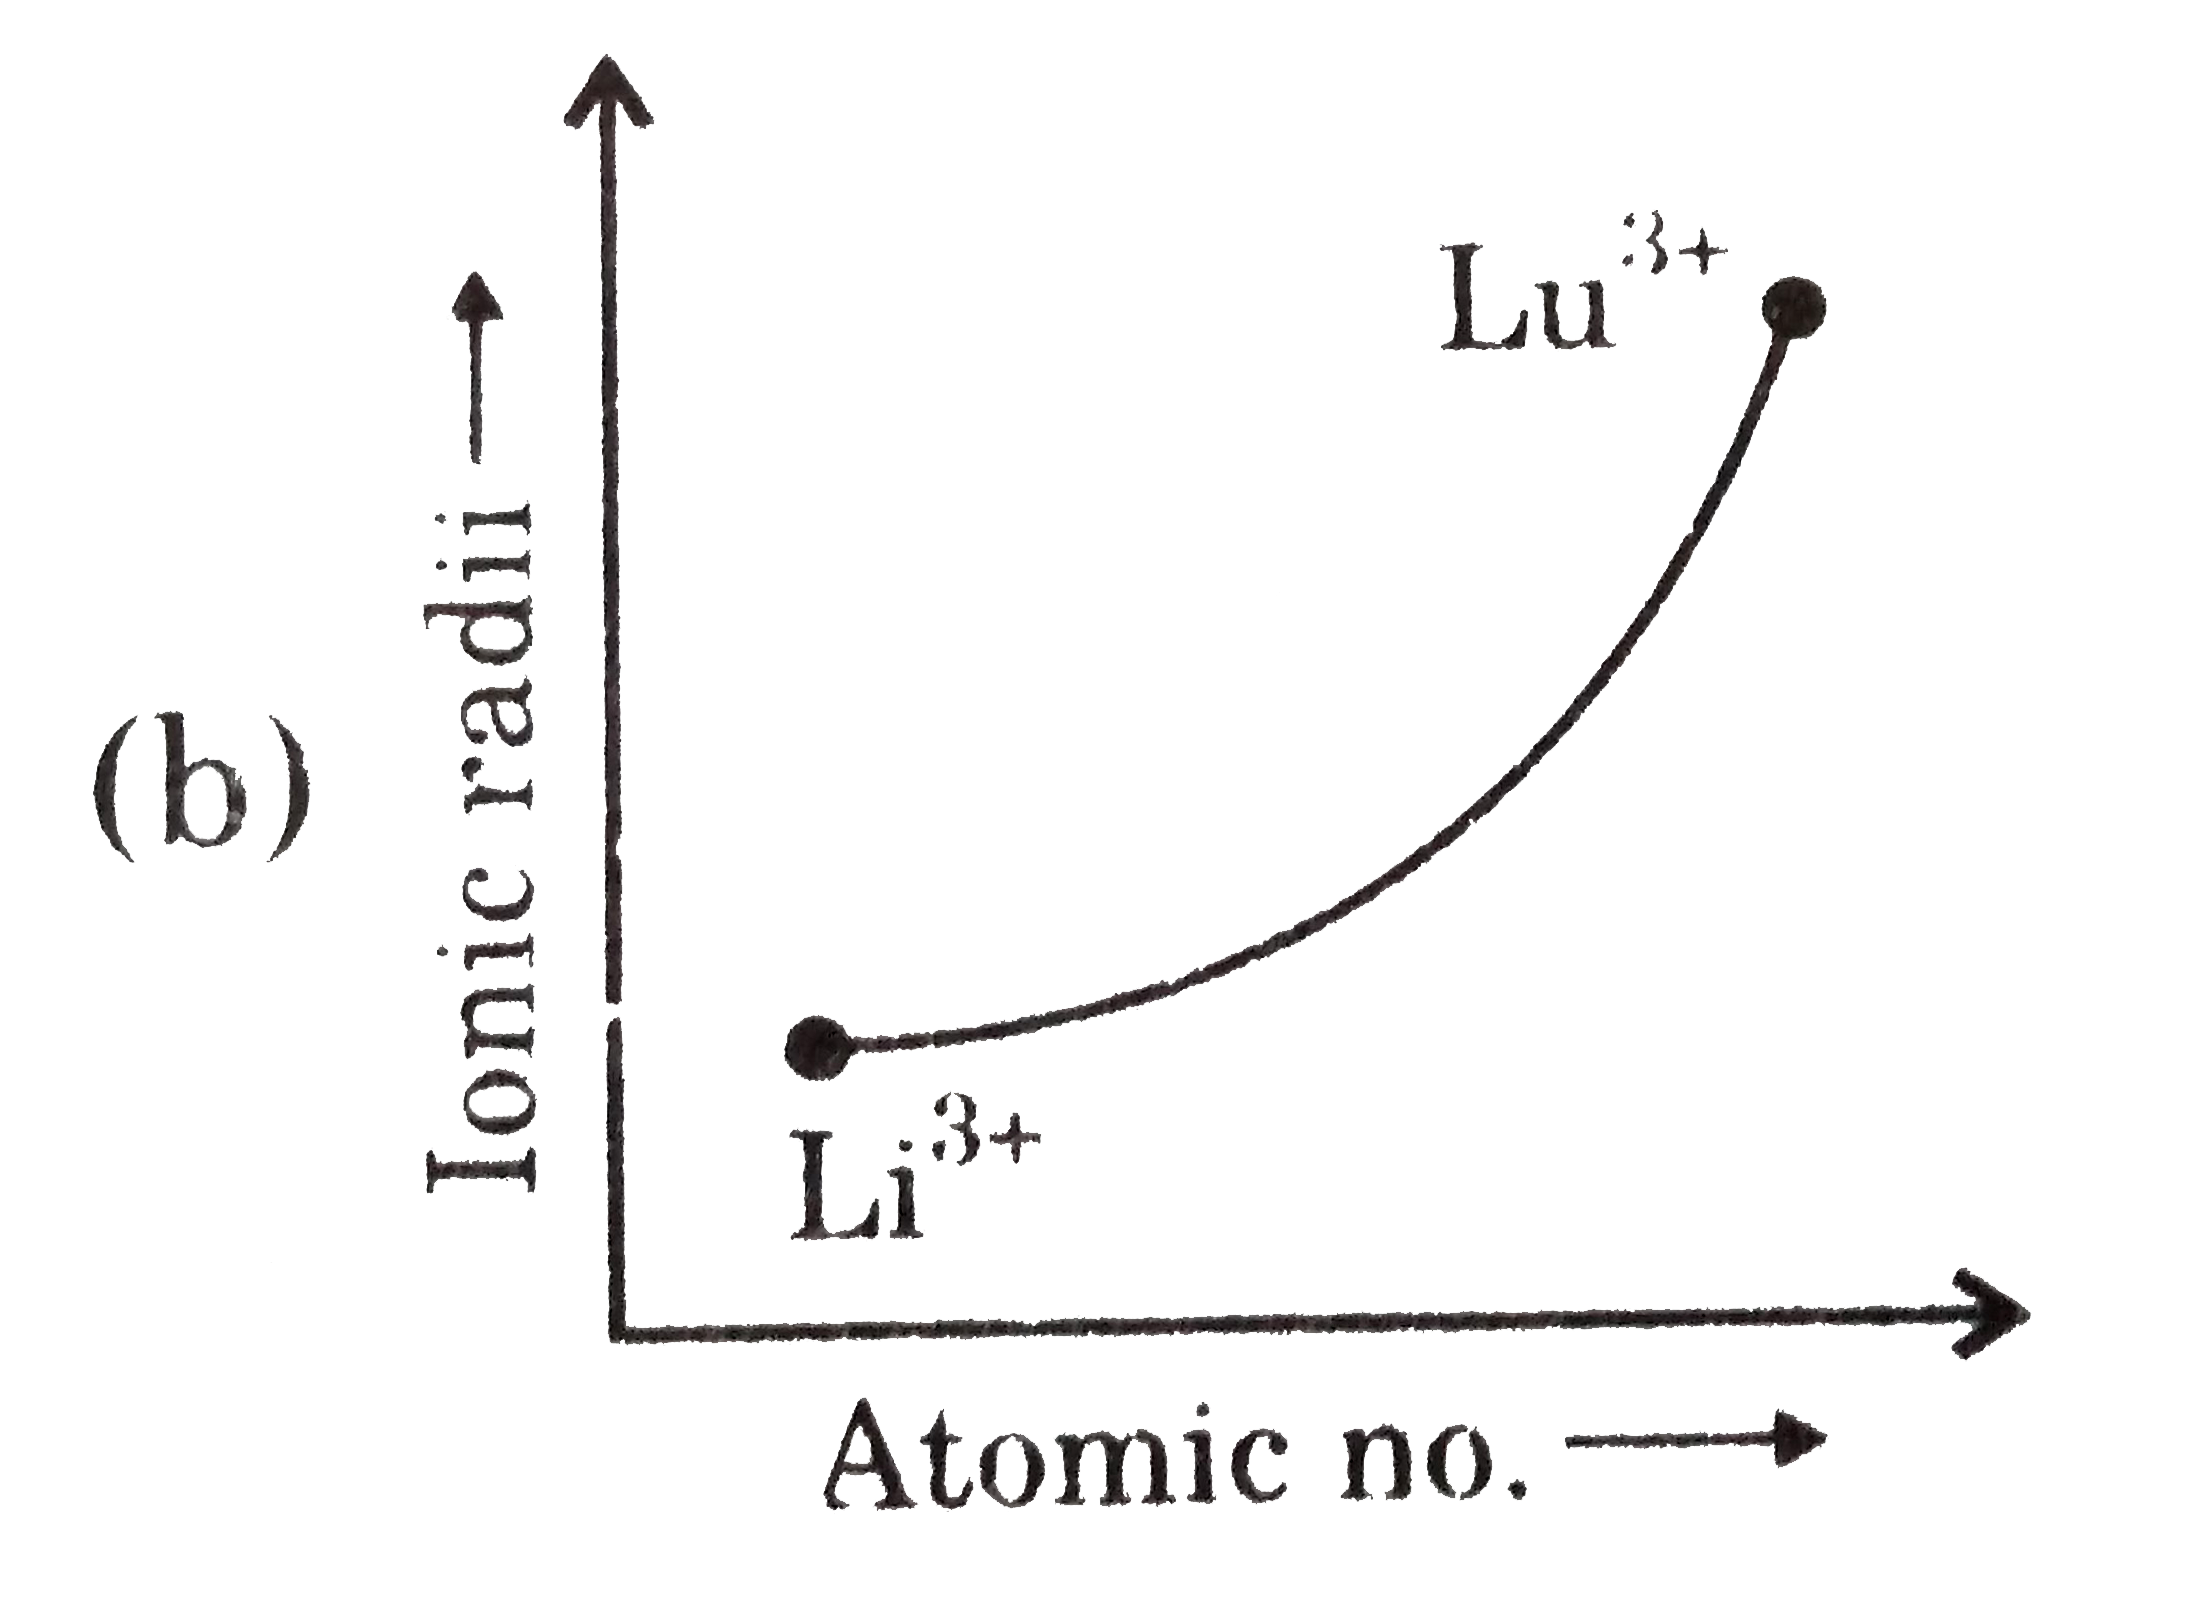
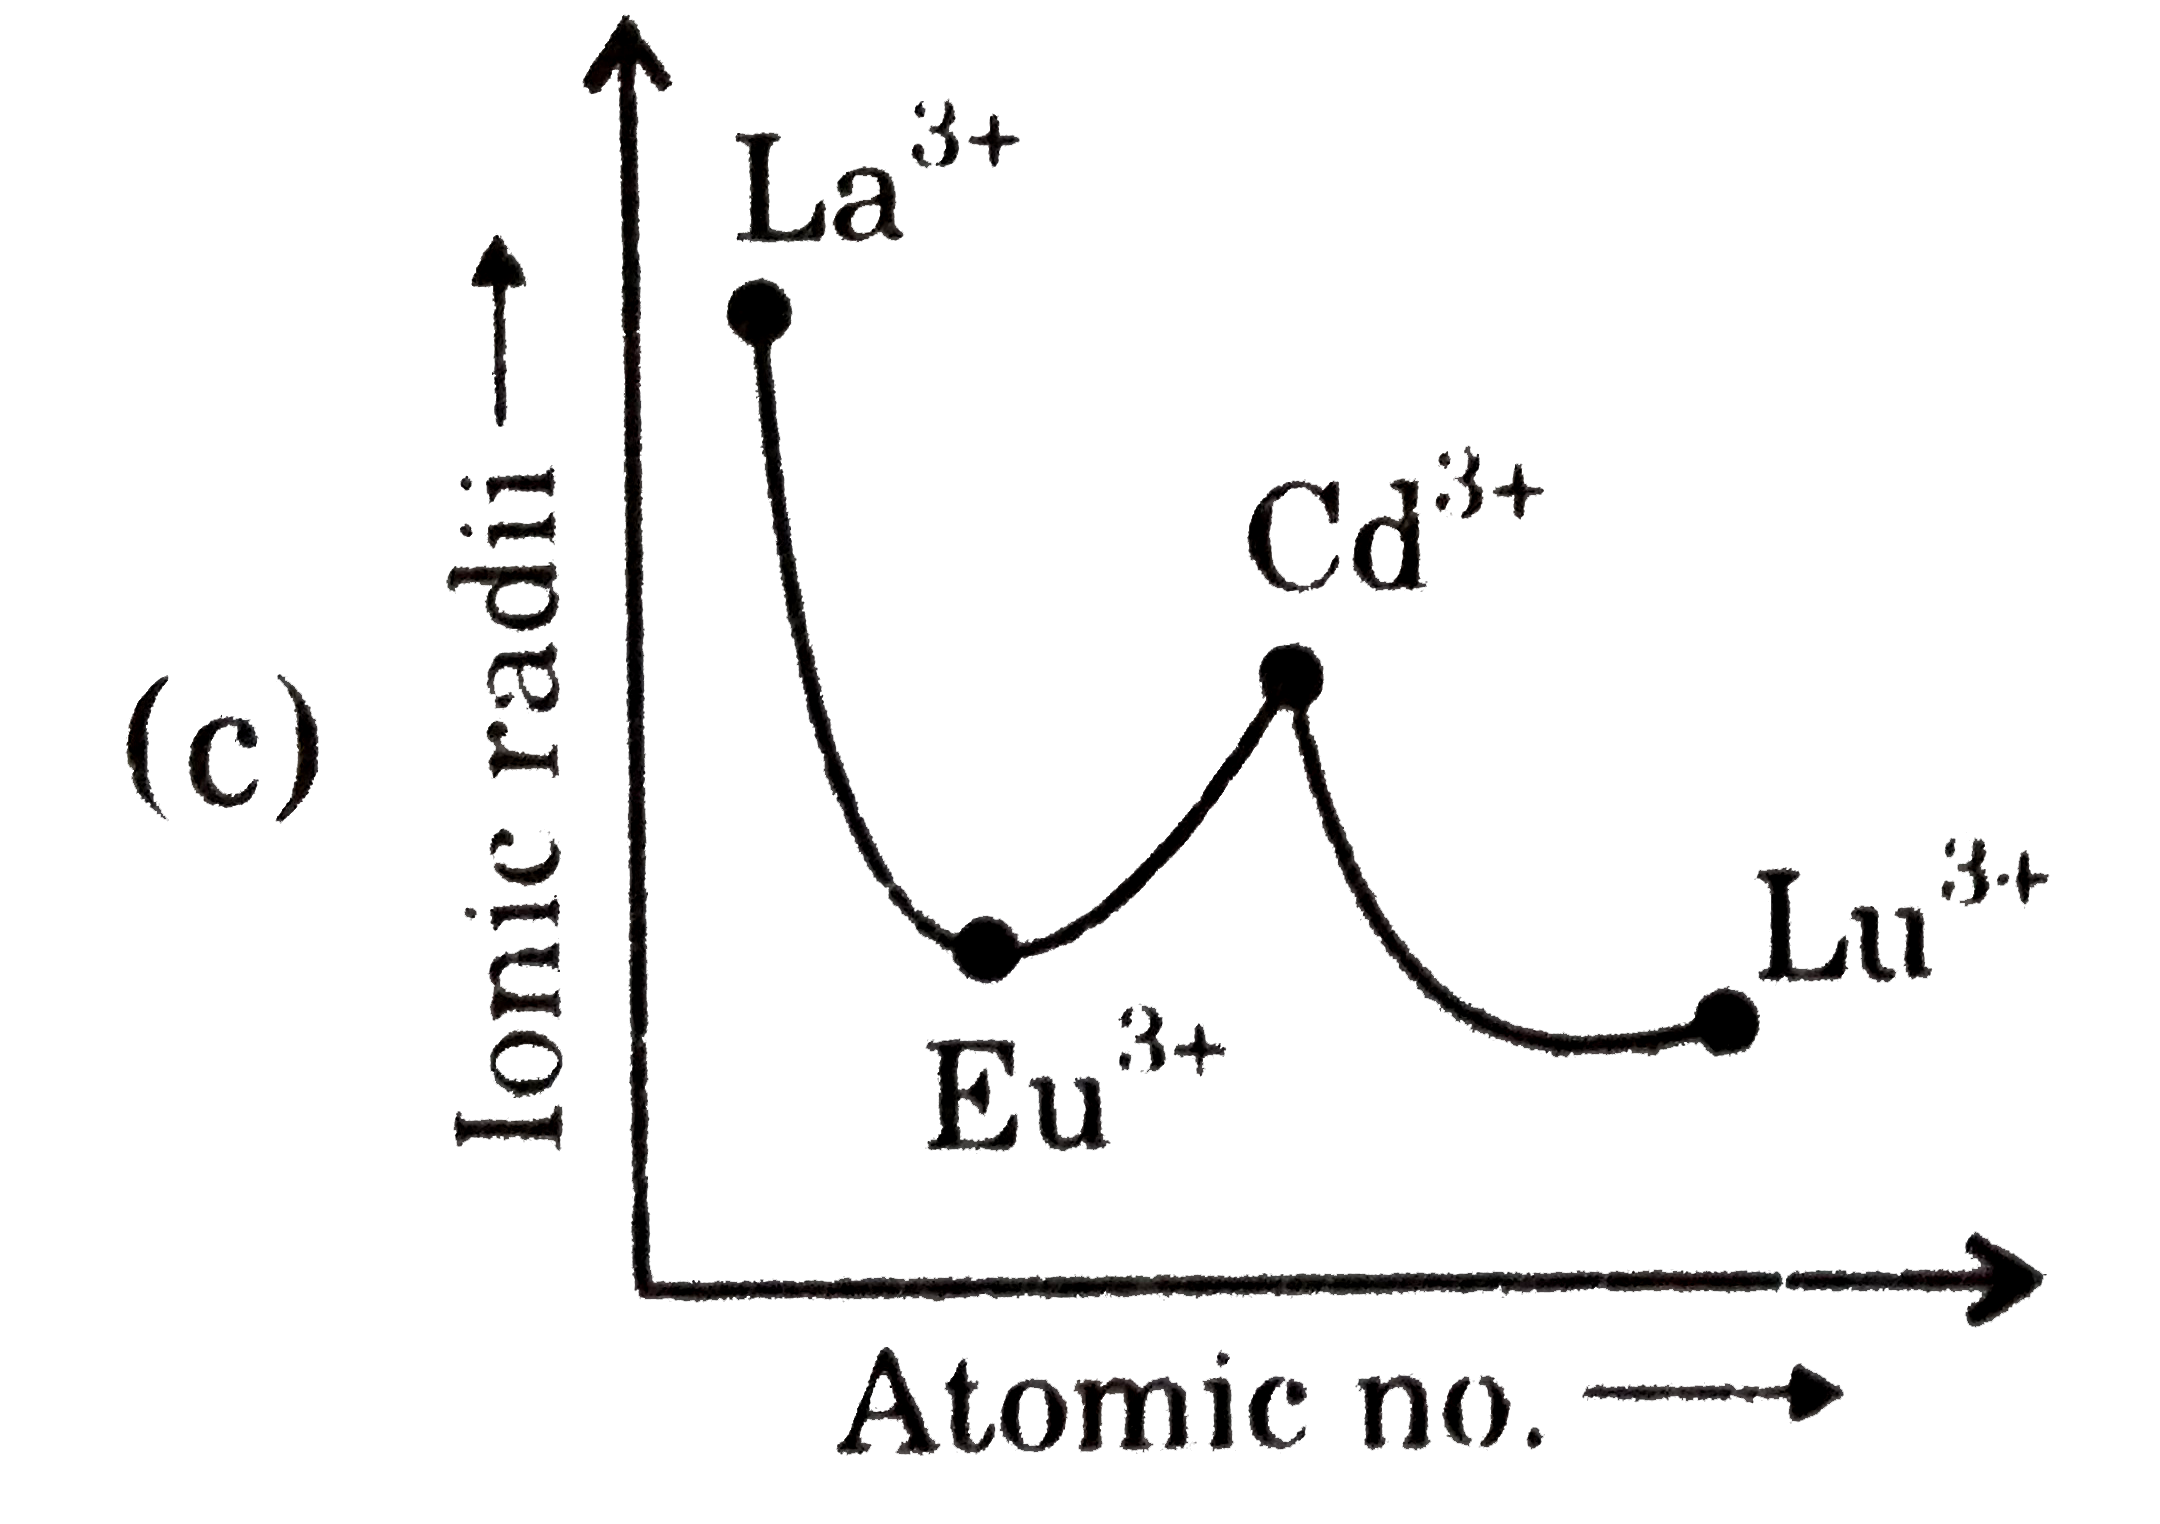
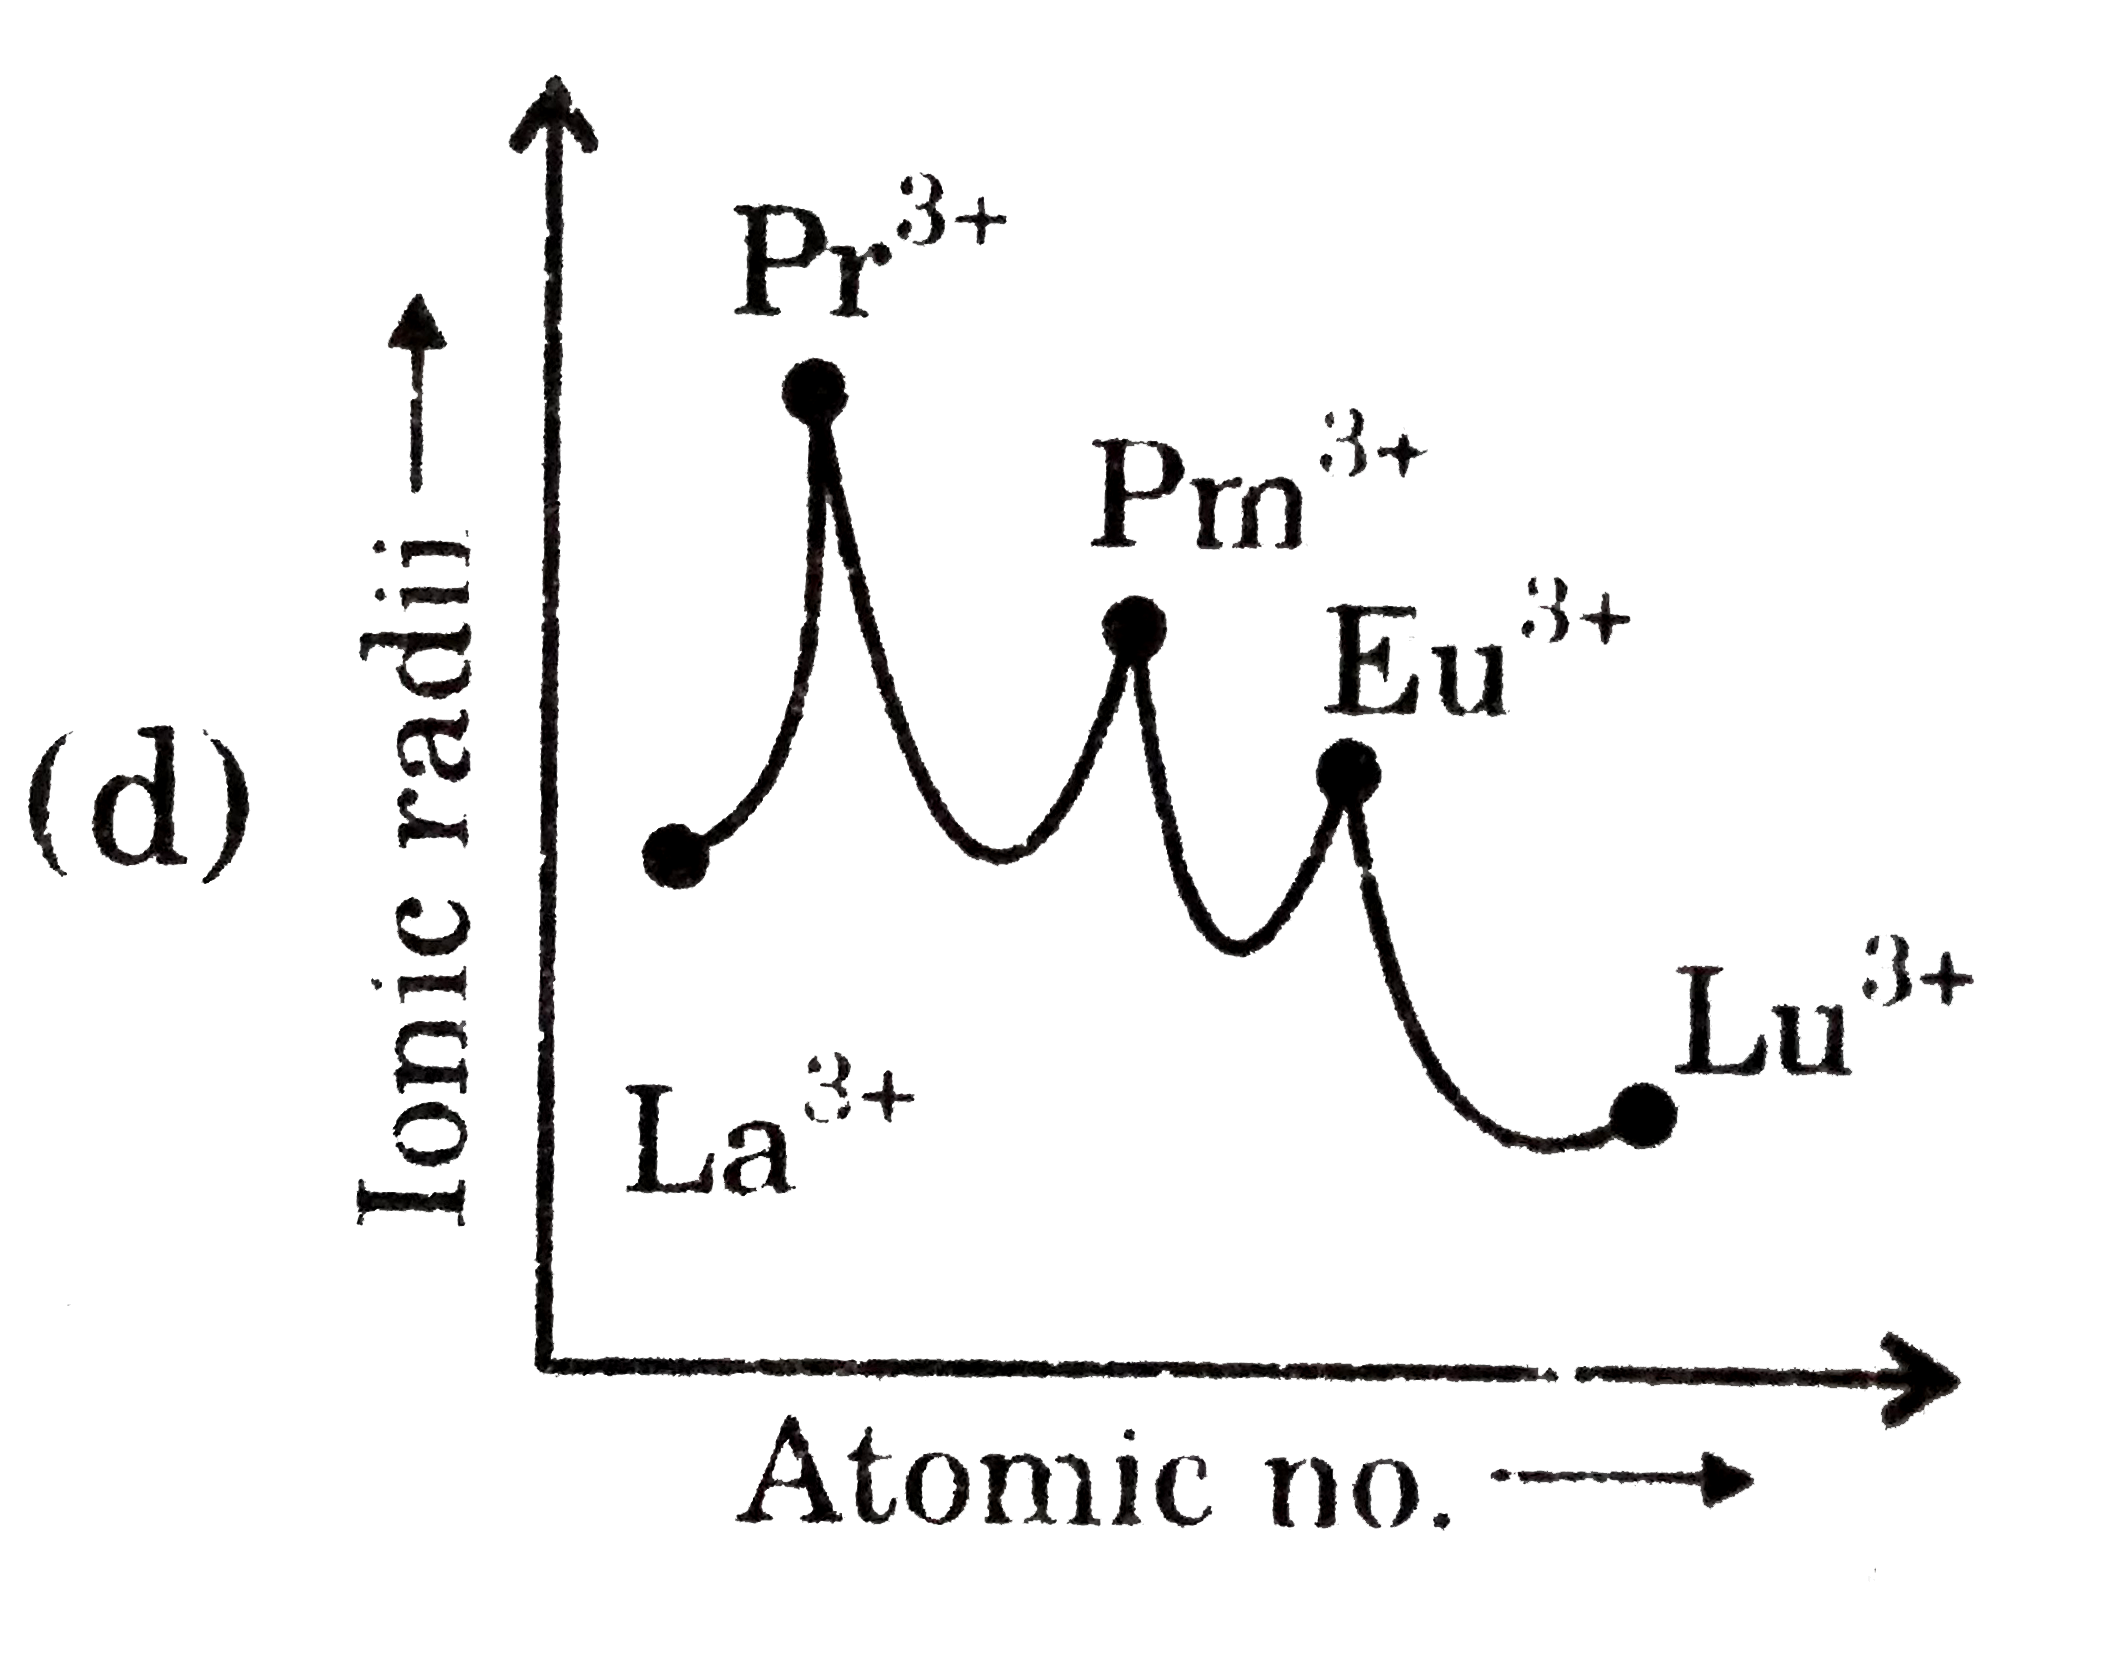
Select the correct graphical representation :

A

B

C

D

Text Solution

AI Generated Solution

The correct Answer is:
To solve the question regarding the correct graphical representation of the relationship between ionic radii and atomic number for lanthanides, we can follow these steps: ### Step 1: Identify the Elements The lanthanides series includes the following elements: - Lanthanum (La) - Cerium (Ce) - Praseodymium (Pr) - Neodymium (Nd) - Promethium (Pm) - Samarium (Sm) - Europium (Eu) - Gadolinium (Gd) - Terbium (Tb) - Dysprosium (Dy) - Holmium (Ho) - Erbium (Er) - Thulium (Tm) - Ytterbium (Yb) - Lutetium (Lu) ### Step 2: Understand the Trend As we move from lanthanum (atomic number 57) to lutetium (atomic number 71) in the lanthanide series: - The atomic number increases. - The ionic radii generally decrease due to the increase in effective nuclear charge. ### Step 3: Plot the Graph On a graph where the x-axis represents the atomic number and the y-axis represents the ionic radii: - As the atomic number increases from 57 to 71, the ionic radii should show a downward trend. - This means the graph will slope downwards from left to right. ### Step 4: Select the Correct Graph Among the provided options, the graph that shows a decreasing trend (downward slope) as the atomic number increases will be the correct representation. According to the video transcript, the first option is the correct one. ### Final Answer The correct graphical representation is **Option 1**, which shows a downward trend in ionic radii as the atomic number increases for the lanthanides. ---
Promotional Banner

Topper's Solved these Questions

  • F-BLOCK ELEMENTS

    GRB PUBLICATION|Exercise Reasoning type|8 Videos
  • F-BLOCK ELEMENTS

    GRB PUBLICATION|Exercise Multiple objective type|9 Videos
  • ENVIRONMENTAL CHEMISTRY

    GRB PUBLICATION|Exercise Straight objective type|40 Videos
  • GRAPHICAL INTERPRETATION

    GRB PUBLICATION|Exercise Subjective Type|23 Videos

Similar Questions

Explore conceptually related problems

Select the correct mathematical representations for Raoult's law.

Graphical Representation Of Work

Choose the correct option for graphical representation of Boyle's Law, which shows a graph of pressure vs volume of gas at different temperatures:

Out of the following graphs, which grpahs shows the correct relation (graphical representation) for LC parallel resonant circuit ?

When HCl (aq) is titrated with NaOH(aq) conductometrically then the graphical representation of the titration will be

Graphical Representation For Motion

Graphical representation of raoults law