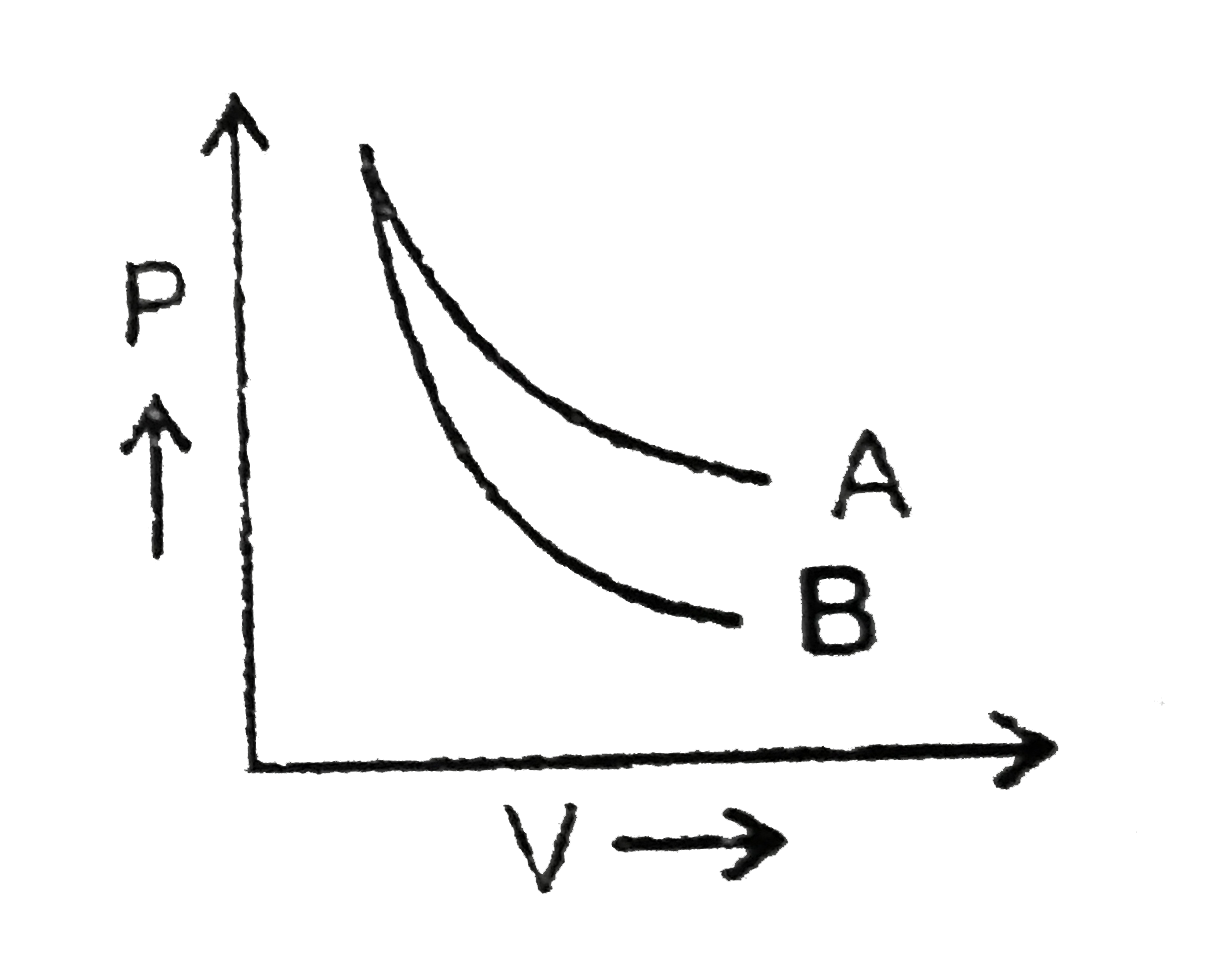
P-V plot for two gases ( assuming ideal ) during adiabatic processes are given in the fig. Plot A and B should correspond respectively to :
P-V plots for two gases during adiabatic processes are shown in the figure. Plots 1 and 2 should corresponds respectively to
P - V plots for two gases, undergoing adiabatic processes are as shown in the figure. Plots 1 and 2 should correspond respectively to
The pressure-volume of varies thermodynamic process is shown in graphs: Work is the mole of transference of energy. It has been observed that reversible work done by the system is the maximum obtainable work. w_(rev) gt w_(irr) The works of isothermal and adiabatic processes are different from each other. w_("isothermal reversible") = 2.303 nRT log_(10) ((V_(2))/(V_(1))) = 2.303 nRT log_(10)((P_(2))/(P_(1))) w_("adiabatic reversible") = C_(V) (T_(1)-T_(2)) P-V plots for two gases during adiabatic processes are given in the given figure: Plot D and Plot C should correspond to
P-V plots for two gases during adiabatic expansion are shown in figure. Plot I and II should correspond respectively to :
NARENDRA AWASTHI-THERMODYNAMICS-Level 3 - Match The Column