A
B
C
D
Text Solution
Verified by Experts
The correct Answer is:


Similar Questions
Explore conceptually related problems
Recommended Questions
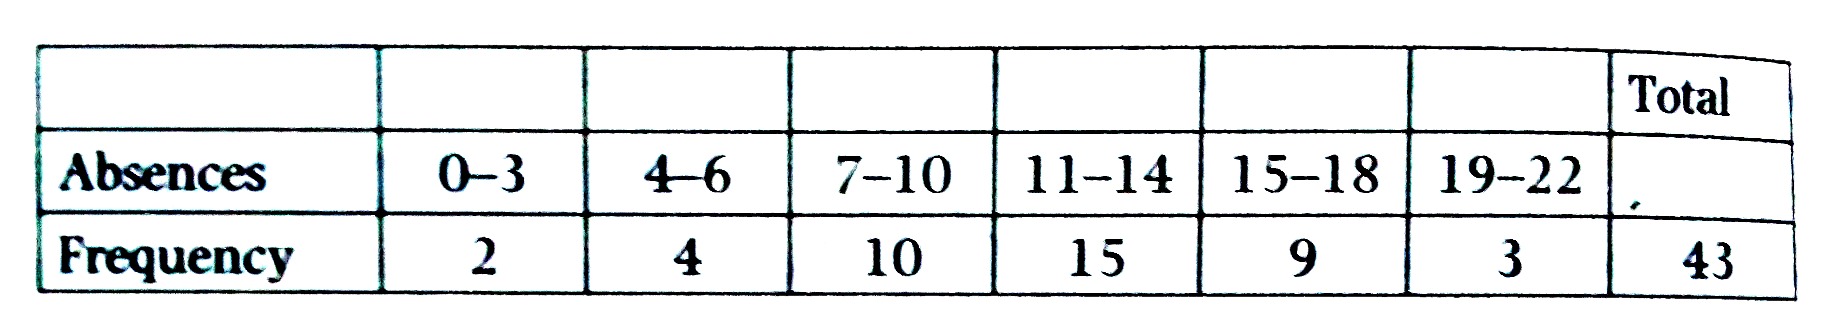
- The frequency chart above shows number of absences for employees for a...
Text Solution
|
- निर्देश :- एक कंपनी में लगातार दो सालो में विभिन्न प्रकार के कर्मचारिय...
Text Solution
|
- In the year 2014, the salary expense of Books Publishing company is 16...
Text Solution
|
- The frequency chart above shows number of absences for employees for a...
Text Solution
|
- In my office the average age of all the female employees is 21 years a...
Text Solution
|
- In my office the average age of all the female employees is 21 years a...
Text Solution
|
- DELL Computer has two branches : One in Ohilo and second in Texas : Th...
Text Solution
|
- DELL Compouter has two branches : One in Ohilo and second in Texas : T...
Text Solution
|
- Percentage of number of different types of employees in a company in t...
Text Solution
|