A
B
C
D
Text Solution
Verified by Experts
The correct Answer is:


Topper's Solved these Questions
Similar Questions
Explore conceptually related problems
ENGLISH SAT-PROBLEM SOLVING AND DATA ANALYSIS-EXERICSE
- The Strand Book Store in New York recently purchased 60 copied of ...
Text Solution
|
- Mark and Brand , two employess on of Intel Corporation have a discus...
Text Solution
|
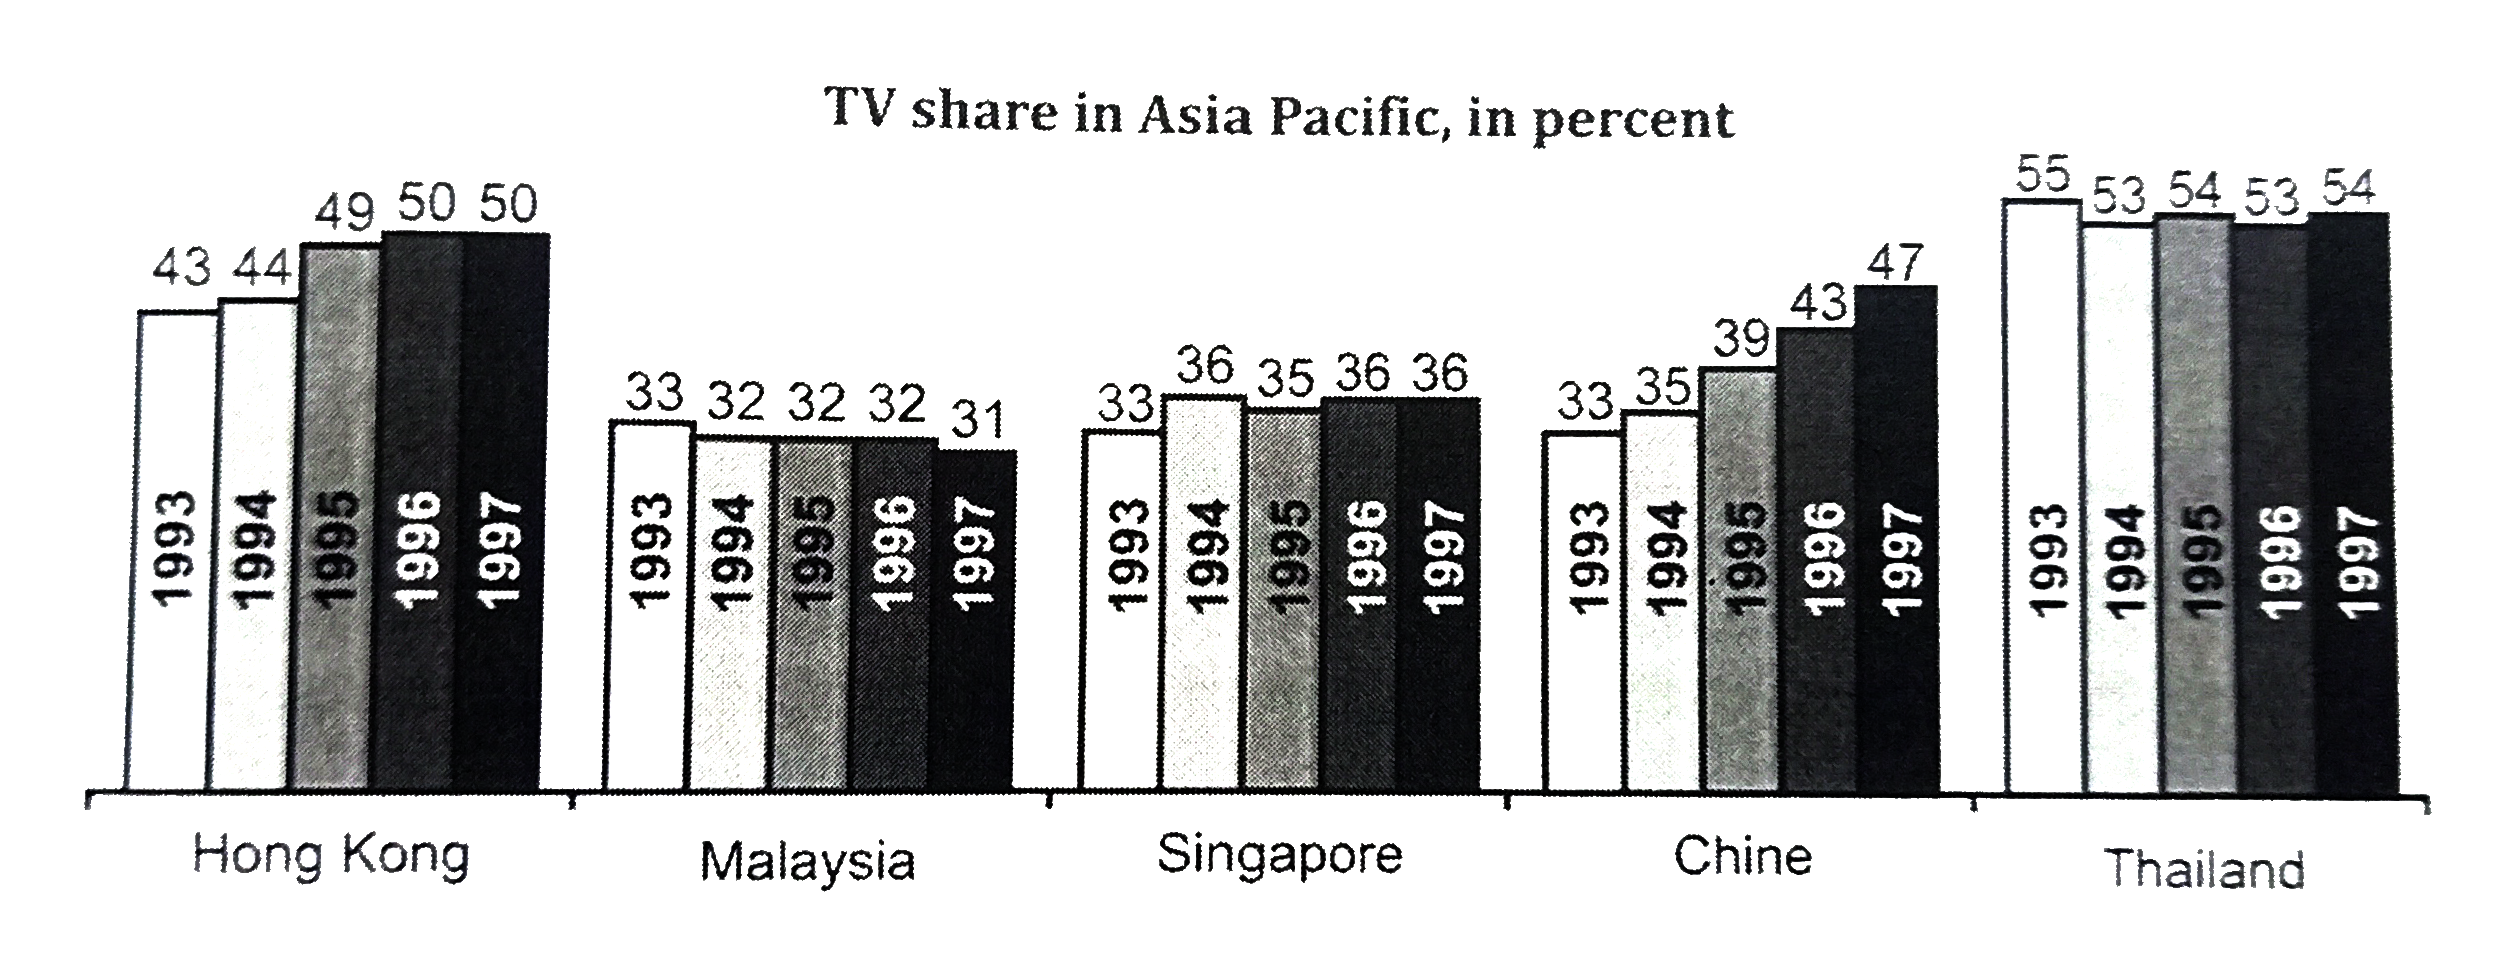
- The graph shows the percenatge of population owining TV sets in va...
Text Solution
|
- The graph shows the percenatge of population owining TV sets in va...
Text Solution
|
- The graph shows the percenatge of population owining TV sets in va...
Text Solution
|
- The graph shows the percenatge of population owining TV sets in va...
Text Solution
|
- If the positive integer N leaves a remainder of 3 when divided b...
Text Solution
|
- If x and y are positive integers and (2x +y) is even, which of the...
Text Solution
|
- Which of the following can be a possible value of the average of ...
Text Solution
|
- In the final examinations for 9^(th) grade students of New York Pub...
Text Solution
|
- Kohl's offers a special discount of 10 % on the selling price on...
Text Solution
|
- P = {1,2,3,4…..20}. How many integers n can be selected form the s...
Text Solution
|
- A crate contains green and red apples in the ratio 7 : 11 . When t...
Text Solution
|
- The average of seven distinct positive integers is 8.Whatis the gre...
Text Solution
|
- Which of the following forms of the equation below directly gives ...
Text Solution
|
- AB denotes a two -digits number with digits as A and B. If (AB)^(2)...
Text Solution
|
- A chemist has 20% and 30% concentration of nitric acid with him. In ...
Text Solution
|
- Napster offers discount on purchase of three garment pieces at a ti...
Text Solution
|
- A survey was made on the breed of dogs kept by pets in different...
Text Solution
|
- During the Inter - School Debate championship, students of the 9^...
Text Solution
|