Text Solution
Verified by Experts
The correct Answer is:


Topper's Solved these Questions
Similar Questions
Explore conceptually related problems
SUBHASH PUBLICATION-STATISTICS -EXERCISE 13.4
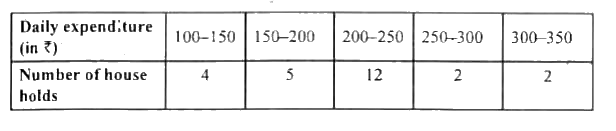
- The table below shows the daily expenditure on food of 25 households i...
Text Solution
|
- The following distribution gives the daily income of 50 workers of a f...
Text Solution
|
- During the medical check-up of 35 students of a class, their weights w...
Text Solution
|
- The following table gives production yield per hectare of wheat of 100...
Text Solution
|