


Topper's Solved these Questions
STATISTICS
SUBHASH PUBLICATION|Exercise EXERCISE 13.3|7 VideosSTATISTICS
SUBHASH PUBLICATION|Exercise EXERCISE 13.4|3 VideosSTATISTICS
SUBHASH PUBLICATION|Exercise EXERCISE 13.4|3 VideosSOME APPLICATIONS OF TRIGONOMETRY
SUBHASH PUBLICATION|Exercise EXERCISE 9.1|16 VideosSURFACE AREAS AND VOLUMES
SUBHASH PUBLICATION|Exercise EXERCISE 15.5|4 Videos
Similar Questions
Explore conceptually related problems
SUBHASH PUBLICATION-STATISTICS -EXERCISE 13.2
- The following table shows the ages of the patients admitted in a hospi...
Text Solution
|
- The following data gives the information on the observed lifetimes (in...
Text Solution
|
- The following data gives the distribution of total monthly household e...
Text Solution
|
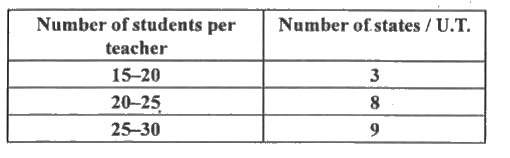
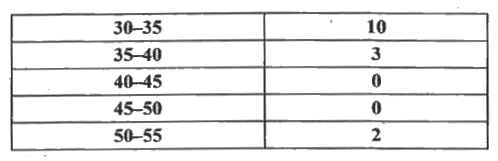
- The following distribution gives the state-wise teacher-student ratio ...
Text Solution
|
- The given distribution shows the number of runs scored by some top bat...
Text Solution
|
- A student noted the number of cars passing through a spot on a road fo...
Text Solution
|