Text Solution
Verified by Experts
The correct Answer is:


Topper's Solved these Questions
Similar Questions
Explore conceptually related problems
SUBHASH PUBLICATION-STATISTICS -EXERCISE 13.3
- The following frequency distribution gives the monthly consumption of ...
Text Solution
|
- If the median of the distribution given below is 28.5, find the values...
Text Solution
|
- A life insurance agent found the following data for distribution of ag...
Text Solution
|
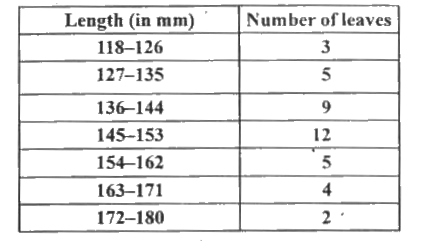
- The lengths of 40 leaves of a plant are measured correct to the neares...
Text Solution
|
- The following table gives the distribution of the life time of 400 neo...
Text Solution
|
- 100 surnames were randomly picked up from a local telephone directory ...
Text Solution
|
- The distribution below gives the weights of 30 students of a class. Fi...
Text Solution
|