Text Solution
Verified by Experts


Topper's Solved these Questions
PLANT GROWTH AND DEVELOPMENT
SUBHASH PUBLICATION|Exercise THREE MARK QUESTIONS AND ANSWERS|8 VideosPLANT GROWTH AND DEVELOPMENT
SUBHASH PUBLICATION|Exercise FIVE MARK QUESTIONS AND ANSWERS|6 VideosPLANT GROWTH AND DEVELOPMENT
SUBHASH PUBLICATION|Exercise FIVE MARK QUESTIONS AND ANSWERS|6 VideosPHOTOSYNTHESIS IN HIGHER PLANTS
SUBHASH PUBLICATION|Exercise Five marks questions and answers|2 VideosPLANT KINGDOM
SUBHASH PUBLICATION|Exercise FIVE MARK QUESTIONS AND ANSWERS|14 Videos
Similar Questions
Explore conceptually related problems
SUBHASH PUBLICATION-PLANT GROWTH AND DEVELOPMENT -TWO MARK QUESTIONS AND ANSWERS
- Expand apical dominance ?
Text Solution
|
- Explain the grand - period of growth.
Text Solution
|
- Explain any two practical applications of auxins.
Text Solution
|
- Explain any two functions of Gibberellins ?
Text Solution
|
- What are growth regulators ? List any two applications of gibberellins...
Text Solution
|
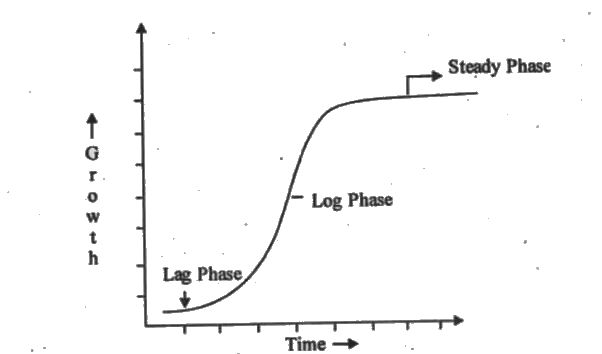
- Draw a graph showing the typical growth curve and mark the phases of g...
Text Solution
|
- Write any two applications of synthetic auxins.
Text Solution
|
- Mention any two commercial applications of NAA.
Text Solution
|
- Mention two physiological functions of abscissic acid.
Text Solution
|
- Why is abscisic acid also known as stress hormone ?
Text Solution
|
- 'Both growth, and differentiation in higher plants are open'. Comment...
Text Solution
|
- Would a defoliated plant respond to photoperiodic cycle ? Why ?
Text Solution
|
- What is vernalization ? How does this help in cultivation of winter va...
Text Solution
|