A
B
C
D
Text Solution
AI Generated Solution
The correct Answer is:


Similar Questions
Explore conceptually related problems
Recommended Questions
- Consider the reversible isothermal expansion of an ideal gas in a clos...
Text Solution
|
- An ideal gas expands from an initial temperature T(1) to a final tempe...
Text Solution
|
- One mole of an ideal gas at a temperature T(1) expands according to th...
Text Solution
|
- In an adiabatic expansion of a gas initial and final temperatures are ...
Text Solution
|
- Write expression for the work done by 1 mole of the gas in each of th...
Text Solution
|
- Consider the reversible isothermal expansion of an ideal gas in a clos...
Text Solution
|
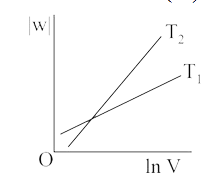
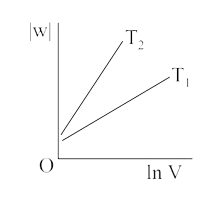
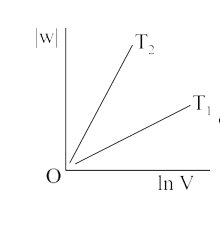
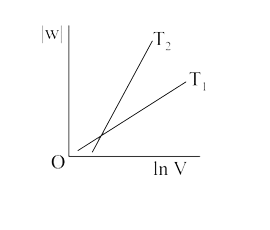
- Two curves are given at temperatures T(1) and T(2) in an isothermal pr...
Text Solution
|
- Isothermal curves for a given mass of gas are shown at two different t...
Text Solution
|
- Freundlich adsorption isotherms for the physical adsorption of a gas a...
Text Solution
|