Text Solution
Verified by Experts
The correct Answer is:


Similar Questions
Explore conceptually related problems
Recommended Questions
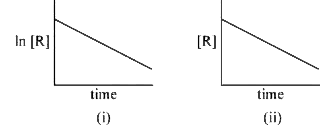
- The given plots represent the variation of the concentration of a reac...
Text Solution
|
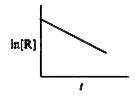
- For chemical reaction R rarr P the variation in the concentration (R )...
Text Solution
|
- For a chemical reactin R rarr P, variation of concentration of R vs ti...
Text Solution
|
- The given plots represent the variation of the concentration of a reac...
Text Solution
|
- The given plots represent the variation of the concentration of a reac...
Text Solution
|
- The given plots represent the variation of the concentration of a reac...
Text Solution
|
- For a chemical reaction R to P, the variation in the concentration (R)...
Text Solution
|
- The given plots represent the variation of the concentration of a reac...
Text Solution
|
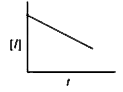
- नीचे दिए गए प्लॉट, दो अभिक्रियाओं (i) तथा (ii) के लिए, अभिकर्मक R की स...
Text Solution
|