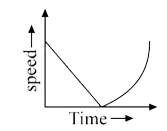
A
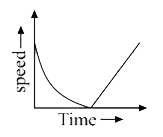
B
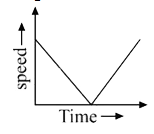
C
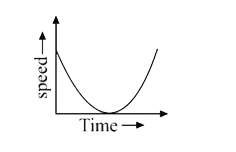
D
Text Solution
Verified by Experts
The correct Answer is:


Similar Questions
Explore conceptually related problems
Recommended Questions
- A ball is thrown vertically upwards. Which of the following plots repr...
Text Solution
|
- A ball is thrown vertically upwards. Which of the following graph/grap...
Text Solution
|
- A ball is thrown vertically upwards. Which of the following plots repr...
Text Solution
|
- A ball is thrown vertically upwards. Which of the following plots repr...
Text Solution
|
- In the following problems the air resistance is constant (air resistan...
Text Solution
|
- A ball is thrown vertically upwards. Which of the following plots repr...
Text Solution
|
- A ball is thrown vertically upwards. Which of the following plots repr...
Text Solution
|
- A ball is thrown vertically upwards. Which of the following graph/grap...
Text Solution
|
- A ball is thrown vertically upwards .Which of the following graph/grap...
Text Solution
|