Text Solution
Verified by Experts
The correct Answer is:


Topper's Solved these Questions
Similar Questions
Explore conceptually related problems
MOTION-CENTRE OF MASS-Exercise - 3 Level-I
- In the arrangement shown in Figure, mA=2kg and mB=1kg. String is light...
Text Solution
|
- A small cube of mass m slides down a circular path of radius R cut int...
Text Solution
|
- A (trolley + child) of total mass 200 kg is moving with a uniform spee...
Text Solution
|
- A ball B is suspended from a string of length l attached to a cart A, ...
Text Solution
|
- A ball B is suspended from a string of length l attached to a cart A, ...
Text Solution
|
- A wedge of mass M = 2m rests on a smooth horizontal plane. A small blo...
Text Solution
|
- A small sphere of radius r = 2cm and mass ‘m’ is placed on a big spher...
Text Solution
|
- In the figure shown the spring is compressed by 'x(0)' and released . ...
Text Solution
|
- In the figure shown the spring is compressed by 'x(0)' and released . ...
Text Solution
|
- 2 mass of block 2 kg & 4 kg are attached to a stiffness spring 100 N/m...
Text Solution
|
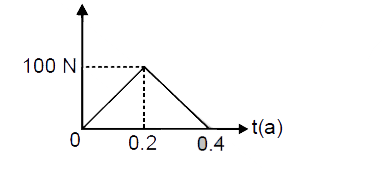
- The figure showns the force versus time graph for a particle. Find t...
Text Solution
|
- The figure showns the force versus time graph for a particle. Find t...
Text Solution
|
- A force F acts on an object (mass=1 kg) which is initially at rest as ...
Text Solution
|
- A man hosing down his driveway hits the wall by mistake. Knowing that ...
Text Solution
|
- A bullet of mass m strikes an obstruction and deviates off at 60° to i...
Text Solution
|
- A neutron intially at rest, decays into a proton, an electron and an a...
Text Solution
|
- A neutron initially at rest, decays into a proton, an electron and an ...
Text Solution
|
- A steel ball of mass 0.5 kg is dropped from a height of 4 m on to a ho...
Text Solution
|
- A steel ball of mass 0.5 kg is dropped from a height of 4 m on to a ho...
Text Solution
|
- Find thrust force on hose pipe if density of water is 10^(3) kg//m^(3)...
Text Solution
|