A
B
C
D
Text Solution
Verified by Experts
The correct Answer is:


Topper's Solved these Questions
SIMPLE HARONIC MOTION
MOTION|Exercise EXERCISE -2 (Leve-I I) ( SECTION - C ) ( Two block system)|1 VideosSIMPLE HARONIC MOTION
MOTION|Exercise EXERCISE -2 (Leve-I I) ( SECTION - E,F) ( Angu lar shm & s imple pendulum)|2 VideosSIMPLE HARONIC MOTION
MOTION|Exercise EXERCISE -2 (Leve-I I) ( SECTION - A ) (– Equation of SHM, Velocity and Acceleration in SHM, Energy of SHM)|3 VideosSIMPLE HARMONIC MOTION
MOTION|Exercise EXERCISE -3 Section - B Previous Year Problems | JEE MAIN|23 VideosSOUND WAVES
MOTION|Exercise Exercise - 3 (Section - B)|14 Videos
MOTION-SIMPLE HARONIC MOTION -EXERCISE -2 (Leve-I I) ( SECTION - B ) (Time per iod and angu lar frequency in SHM)
- The equation of motion for an oscillating particle is given by x = 3si...
Text Solution
|
- A particle is executing SHM with amplitude A, time period T, maximum a...
Text Solution
|
- The displacement of a particle varies according to the relation x = 3 ...
Text Solution
|
- For a particle executing SHM, x = displacement from mean position, v =...
Text Solution
|
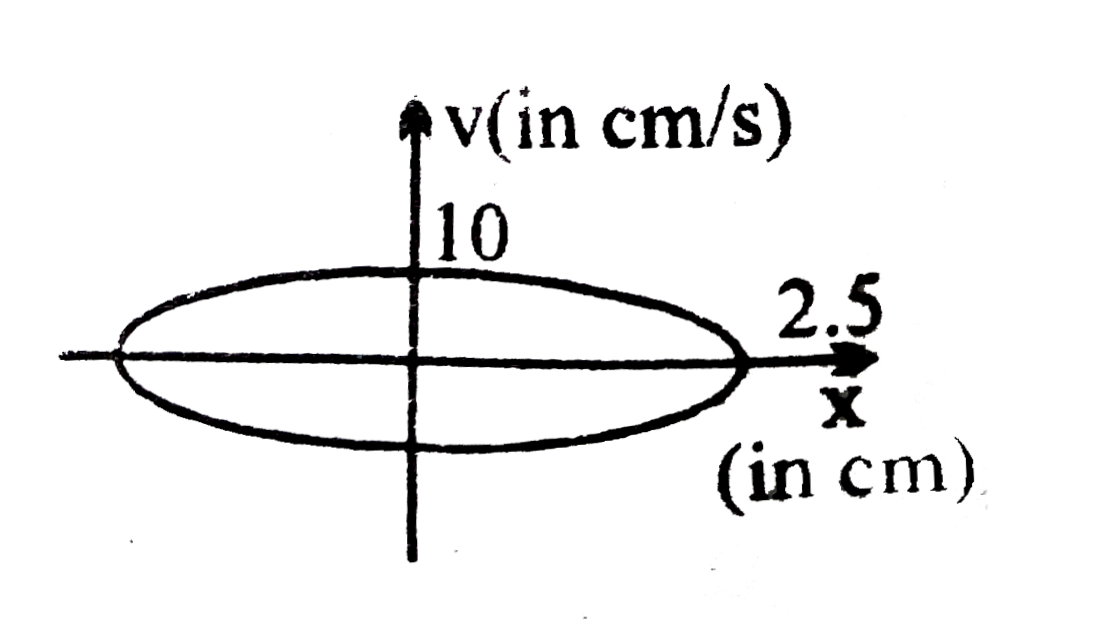
- The figure shows a graph between velocity and displacement (from mean ...
Text Solution
|