A
B
C
D
Text Solution
Verified by Experts
The correct Answer is:


Topper's Solved these Questions
ELASTICITY AND THERMAL EXPANSION
MOTION|Exercise Exercise -1 (Section B - Thermal Stress, Hookes Law)|6 VideosELASTICITY AND THERMAL EXPANSION
MOTION|Exercise Exercise -1 (Section C - Youngs Modulus, Poissions Ratio)|4 VideosELASTICITY AND THERMAL EXPANSION
MOTION|Exercise Exercise - 4 (Level-II)|11 VideosELASTICITY
MOTION|Exercise EXERCISE -3|60 VideosElectrical Instrument
MOTION|Exercise EXERCISE -3|16 Videos
Similar Questions
Explore conceptually related problems
MOTION-ELASTICITY AND THERMAL EXPANSION-Exercise -1 (Section A - Stress & types, Strain & types + Types of Modulus + Energy Problems + Graphs)
- For the following statement : (a) Glass is more elastic than rubber ...
Text Solution
|
- Two smilar balls, one of which is made of ivory while the other of cla...
Text Solution
|
- On stretching some substances, permanent elongation is caused, because
Text Solution
|
- Select the correct statement on the basis of the given graph :
Text Solution
|
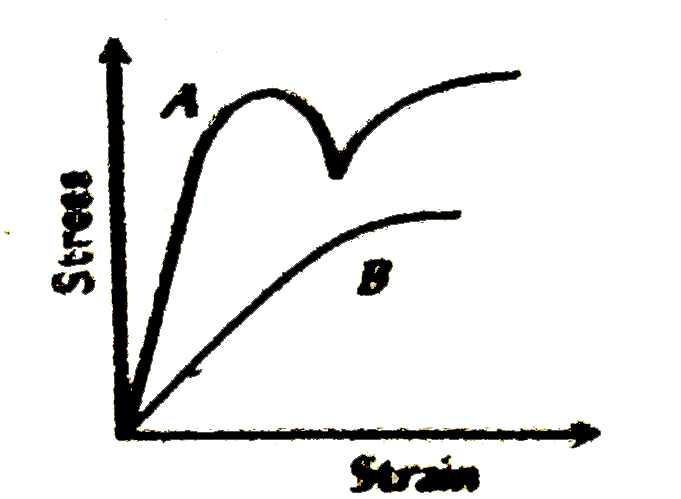
- The diagram shows stress v/s strain curve for the materials A and B. F...
Text Solution
|
- The potential energy U between two molecules as a function of the dist...
Text Solution
|