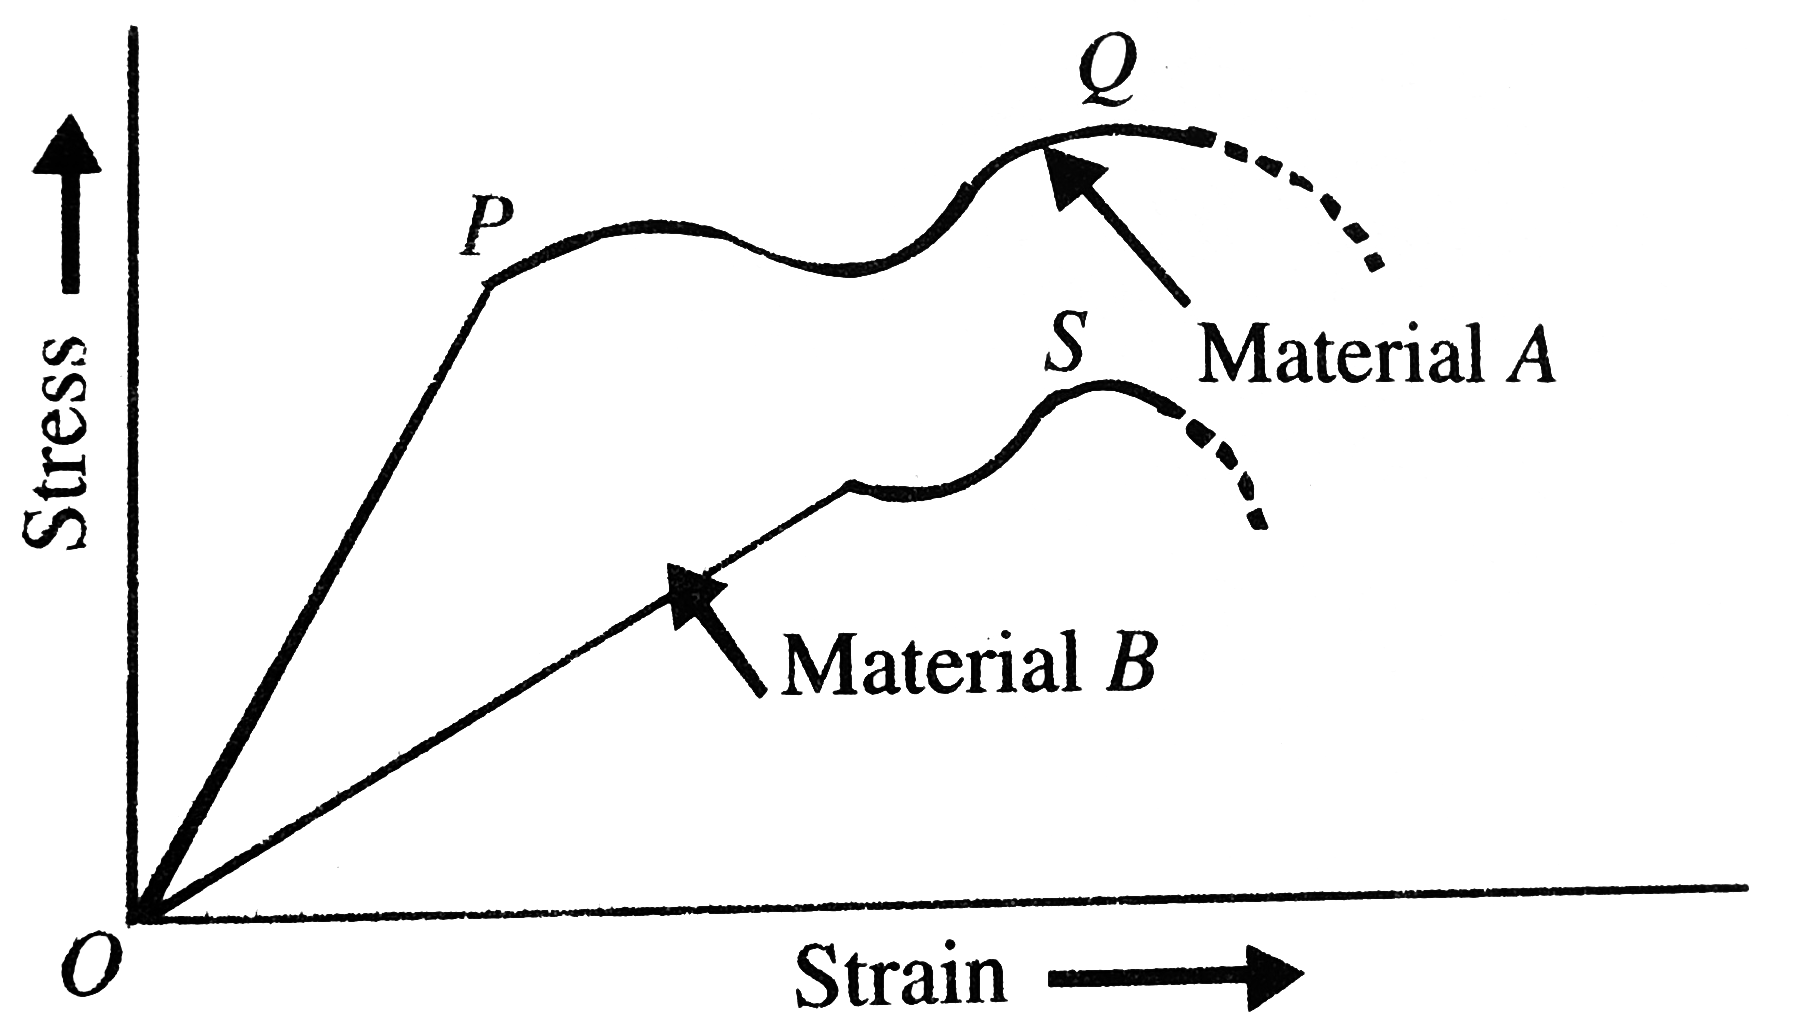
Home
Class 12
PHYSICS
Figure shows the stress-strain graphs fo...

Figure shows the stress-strain graphs for materials .`A` and `B`. From the graph it follows that

A

material A has a higher Young's modulus

B

material B is more ductile

C

material A can withstand greater stress

D

material A can withstand greater stress

Text Solution

Verified by Experts

The correct Answer is:
A, D
Promotional Banner

Topper's Solved these Questions

  • ELASTICITY AND THERMAL EXPANSION

    MOTION|Exercise Exercise - 2 (Level-II) (Section D - Thermal Expansion (Solid , Liquids & Gas) & types, Applications (Ex Bimetallic strip etc))|2 Videos
  • ELASTICITY AND THERMAL EXPANSION

    MOTION|Exercise Exercise - 3 (Level-I) (Section A - Stress & types, Strain & types + Types of Modulus + Energy Problems + Graphs)|4 Videos
  • ELASTICITY AND THERMAL EXPANSION

    MOTION|Exercise Exercise - 2 (Level-II) (Section B - Thermal Stress, Hookes Law)|3 Videos
  • ELASTICITY

    MOTION|Exercise EXERCISE -3|60 Videos
  • Electrical Instrument

    MOTION|Exercise EXERCISE -3|16 Videos

Similar Questions

Explore conceptually related problems

Figure shows the stress-strain curve of two metals P and Q . From the graph, it can be concluded that

The diagram shows stress v/s strain curve for the materials A and B. From the curves we infer that

The stress- strain graphs for materials A and B are as shown. Choose the correct alternative

The diagram shoes stress v/s strain curve for the materials A and B. From the curves we infer that

The stress versus strain graph for two materials A and B are shown in fig. the graph are on the same scale. ltbr. (a) Which materail has greater Young's modulus? (b) which of the two is stronger materail?

The stress-strain graphs for two materials A and are shown in figure. The graphs are drawn to the same scale. Select the correct statement

The stress and strain graphs for two materials, A and B are shown here. Answer the following: give reasons

Materials get deformed when force is applied. Some of them regain their status when the applied force is removed. They are termed as elastic. Those of which not regaining are called plastic. There may be delay in the regaining in some materials. They are said to have got elastic aftereffect, since they have gone beyond the elastic limit. Repeated application and removal of force leads to fatigueness in the material. Fatigued materials may break at any point time and so are avoided. The stress strain graph for two materials A and B is shown in the following figure: The time in which the two materials regain their original status is t_(A) and t_(B) related as t_(B)=2t_(B) . Then the material under elastic aftereffect (relatively) is

Figure shows the displacement time graphs of two simple harmonic motions I and II. From the graph it follows that

Figure shows position-time graph of two cars A and B.