A
B
C
D
Text Solution
Verified by Experts
The correct Answer is:


MOTION-Capacitance -EXERCISE -4 LEVEL 1
- A parallel plate capacitor is made by stacking n equally spaced plates...
Text Solution
|
- A fully charged capacitor has a capacitance 'C'. It is discharged thro...
Text Solution
|
- A parallel plate condenser with a dielectric of dielectric constant K ...
Text Solution
|
- A battery is used to charge a parallel plate capacitor till the potent...
Text Solution
|
- A parallel plate capacitor with air between the plates has capacitance...
Text Solution
|
- LetC be the capacitance of a capacitor discharging through a resistor ...
Text Solution
|
- A resistor 'R' and 2(mu)F capacitor in series is connected through a s...
Text Solution
|
- Combination fo two identical capacitors, a resistor R and a dc voltage...
Text Solution
|
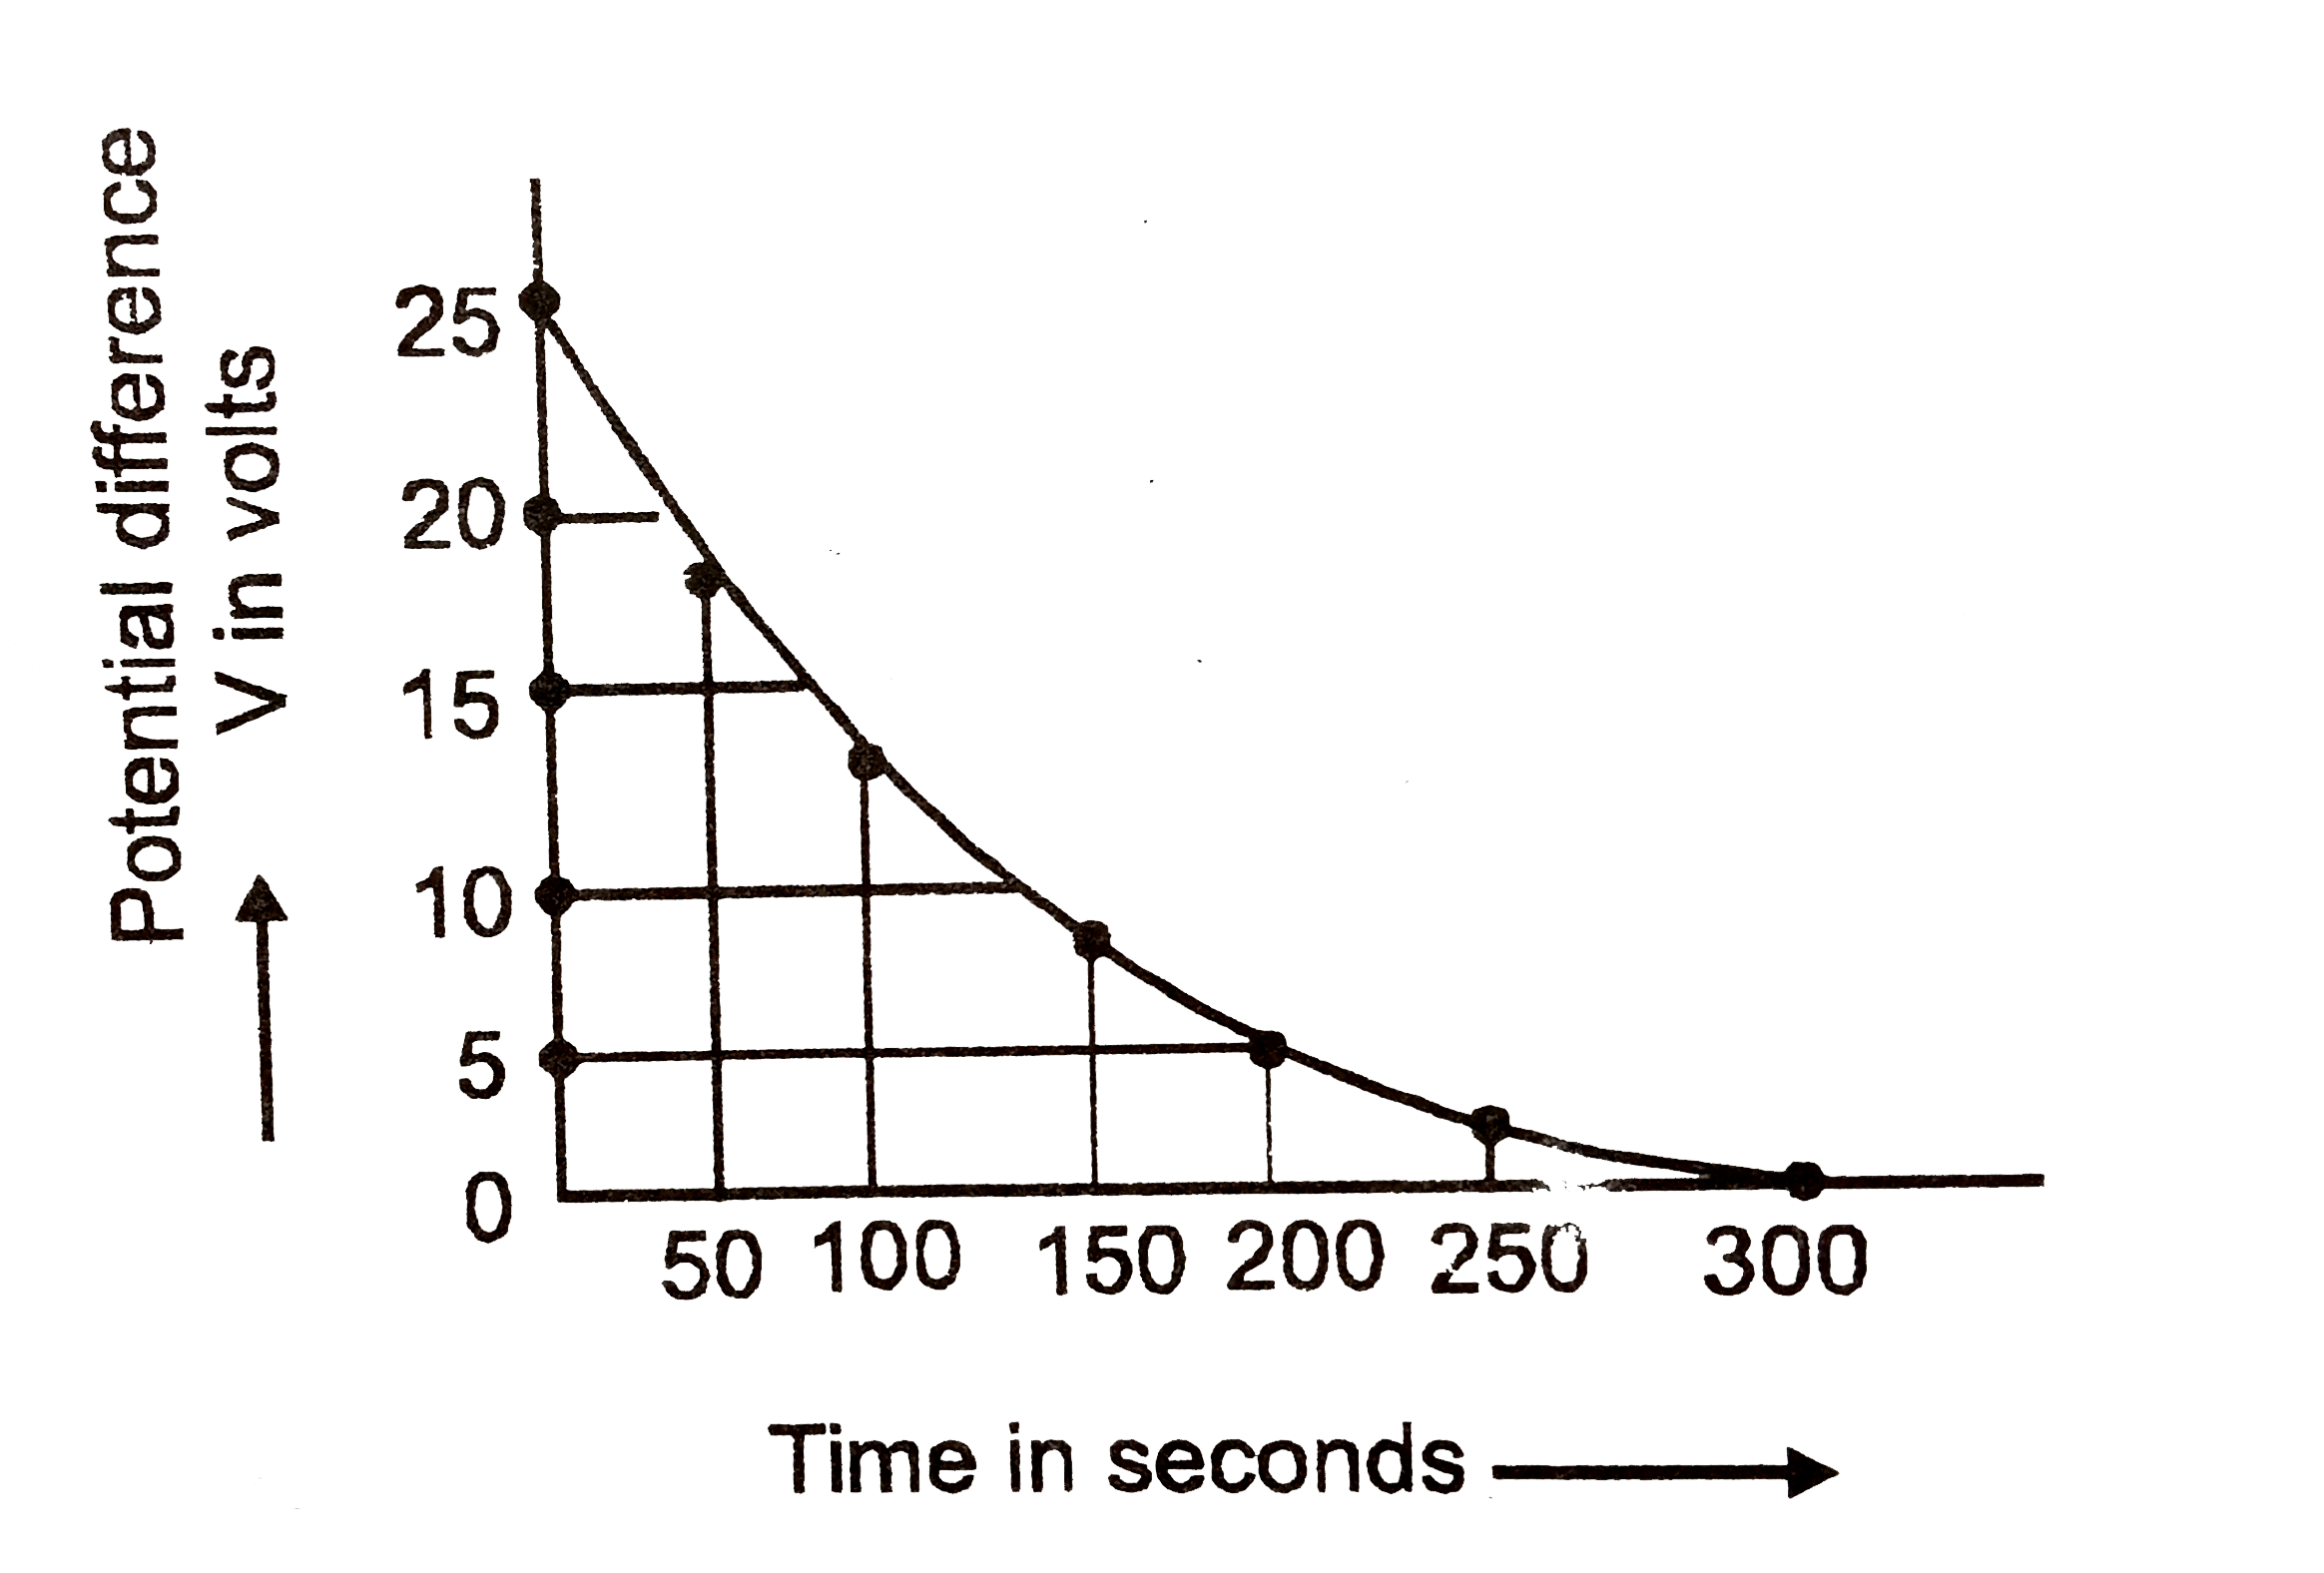
- The figure shows an experimental plot discharging of a capacitor in an...
Text Solution
|
- Two capacitors C1 and C2 are charged to 120V and 200V respectively. It...
Text Solution
|
- A parallel plate capacitor is made of two circular plates separated by...
Text Solution
|
- In the givven circuit, charge Q2 on the 2muF capacitor changes as C is...
Text Solution
|
- A combination of capacitors is set up as shown in the figure. The magn...
Text Solution
|
- A capacitance of 2 muF is required in an electrical circuit across a p...
Text Solution
|
- A parallel plate capacitor of capacitance 90 pF is connected to a batt...
Text Solution
|