A
B
C
D
Text Solution
Verified by Experts
The correct Answer is:


Topper's Solved these Questions
Similar Questions
Explore conceptually related problems
PRINCETON-FUNCTIONS AND GRAPHS-Functions and Graphs Drill 2: Calculator -Permitted Section
- If f(x)=sqrt(3x-2), what is the smallest possible value of f(x)?
Text Solution
|
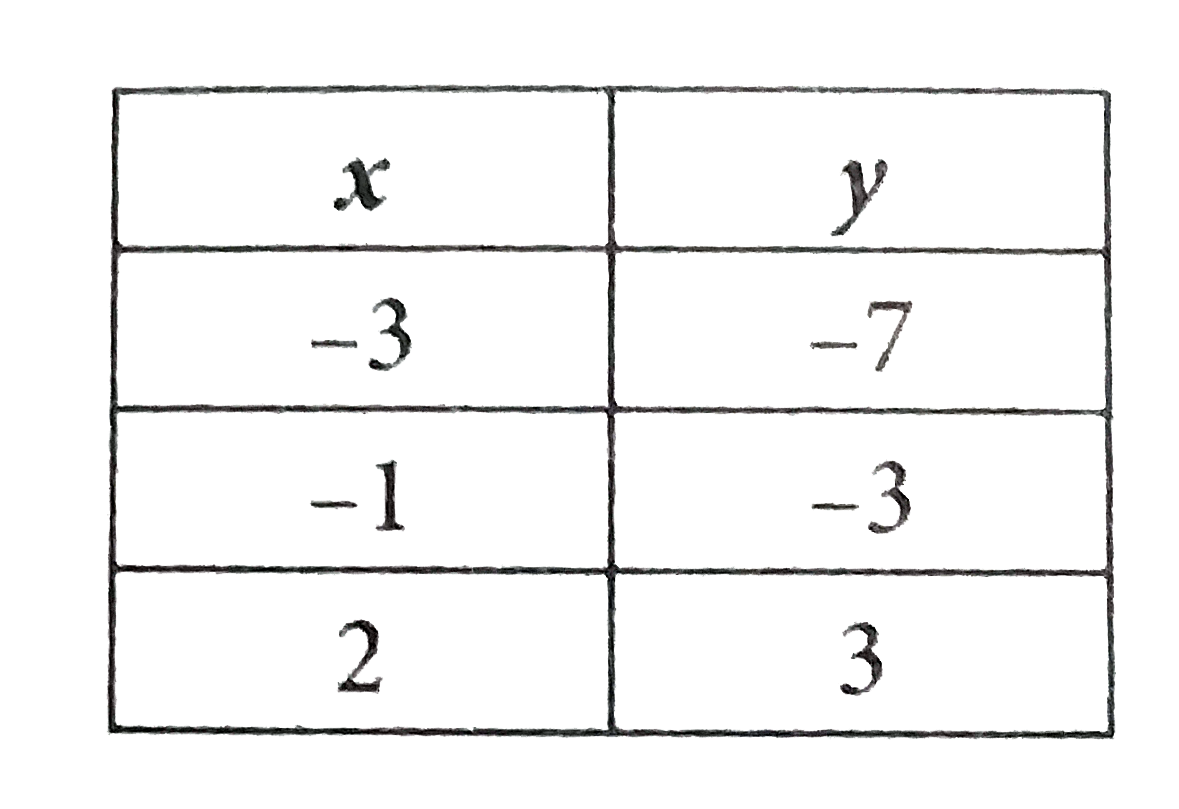
- Based on the chart above, which of the following could express the rel...
Text Solution
|
- Line l contains points (3, 2) and (4, 5). If line m is perpendicular t...
Text Solution
|
- If f(x)=2x^(2)+4 for all real numbers x, which of the following is equ...
Text Solution
|
- The graph of y=g(x) is shown in the figure above. If g(x)=ax^2+bx+c f...
Text Solution
|
- Carlos and Katherine are estimating acceleration by rolling a ball fro...
Text Solution
|