


PRINCETON-PRACTICE TEST 1-Math test-Calculator
- The scatterplot above shows data for ten accounts opened by a company ...
Text Solution
|
- If x/3=4 and x+y=32, what is the value of x-y?
Text Solution
|
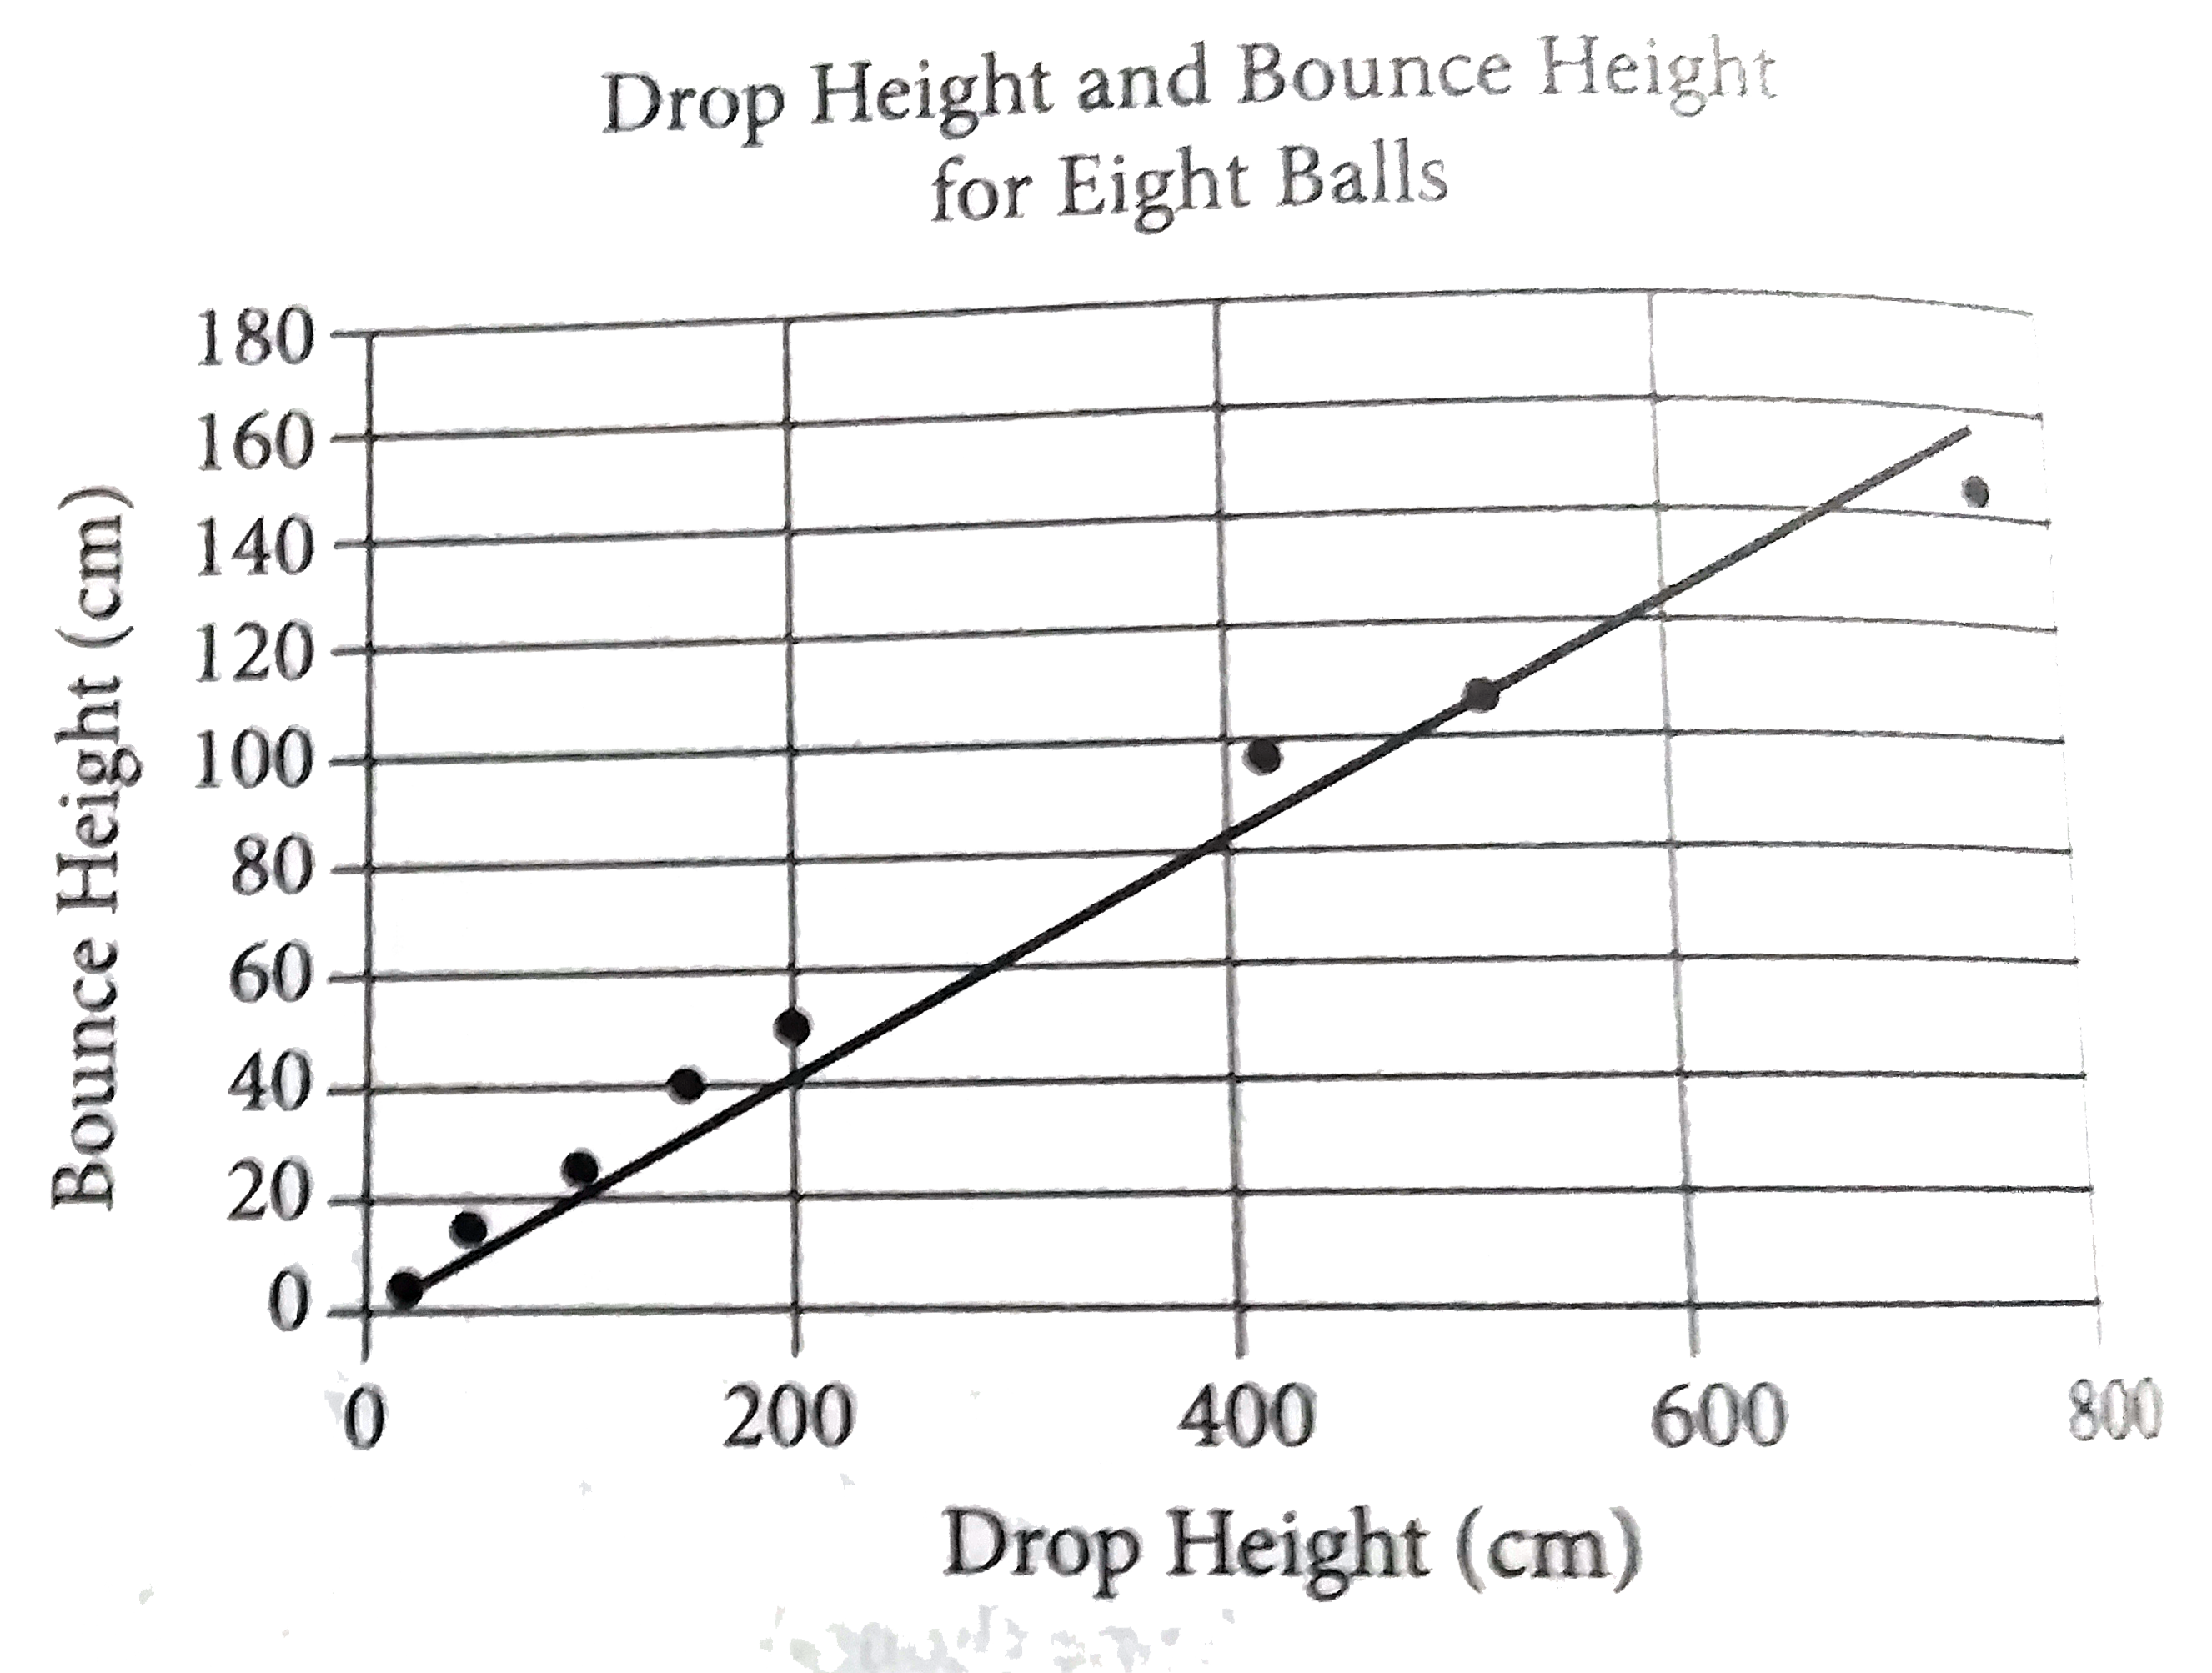
- The scatterplot above shows the height in centimeters for both the dro...
Text Solution
|
- Formula A: BMI=w/h^2 Formula B: BMI=(4w-100)/5 The formulas above ...
Text Solution
|
- Formula A: BMI=w/h^2 Formula B: BMI=(4w-100)/5 The formulas above ...
Text Solution
|
- The number of bacteria colonies h hours after the beginning of an expe...
Text Solution
|
- The world bank measures the amount of land devoted to agriculture amon...
Text Solution
|
- To ship figurines, the figurines are placed in a rectangular box and t...
Text Solution
|
- The economy of Argentina as measured by its Gross Domestic product (GD...
Text Solution
|
- The table above gives the average weight, expressed in both grams and ...
Text Solution
|
- The table above gives the average weight, expressed in both grams and ...
Text Solution
|
- (x-2)^2+(y+5)^2=36 IF a circle in the xy-plane has the equation abov...
Text Solution
|
- {:("Month","Number of Peppers"),("June","2,200"),("July","2,640"):} ...
Text Solution
|
- In the xy-plane above, a point (not shown) with coordinates (a,b) lies...
Text Solution
|
- The raw score on a certain standardized test is determined by subtract...
Text Solution
|
- One of the first diets to limit the intake of carbohydrates was prescr...
Text Solution
|
- What is the slope of line l shown in the xy-plane above?
Text Solution
|
- -9-a=b a^2-6a-9=b IF the ordered pair (a,b) satisfies the system o...
Text Solution
|
- In the figure above, sin T=5/13. IF TV=24, XZ=13, and angle W cong ang...
Text Solution
|
- Point O is the center of the circle above. What fraction of the circu...
Text Solution
|