Home
Class 12
MATHS
The scatterplot above shows the relation...


The scatterplot above shows the relationship between gas mileage, in miles per gallon, and weight , in tons, for 10 cars selected at random. The line of best fit models the gas mileage based on the weight of the car. What is the weight, in tons, of the car for which the actual gas mileage was closest to the predicted value?

A

2.5

B

4.5

C

15

D

27

Text Solution

Verified by Experts

The correct Answer is:
A
Promotional Banner

Topper's Solved these Questions

  • PRACTICE TEST 2

    PRINCETON|Exercise Math test -Calculator|37 Videos
  • PRACTICE TEST 1

    PRINCETON|Exercise Math test-Calculator|38 Videos
  • PRACTICE TEST 3

    PRINCETON|Exercise Math test - Calculator|38 Videos

Similar Questions

Explore conceptually related problems

The scatterplot above shows the federal-mandated minimum wage every 10 years between 1940 and 2010. A line of best fit is shown, and its equation is y = 0.096x − 0.488.What does the line of best fit predict about the increase in the minimum wage over the 70-year period?

The scatterplot above shows the weight, in ounces,of the fruits on a certain truffula tree from days 55 to 85 after flowering. According to the line of best fit in the scatterplot above, which of the following is the closest approximation of the number of days after flowering of a truffula fruit that weighs 5.75 ounces?

There are more than 250 known species of monkeys in the world. The scatterplot above shows the average height and weight of 12 species of particularly small monkeys, most of the which live in the Amazon Basin of South America. What is the height, in inches, of the monkeys represented by the data point that is farthest from the line of best fit (not shown)?

The average gas mileage for n vehicles on one car lot is 21 miles per gallon. The average gas mileage for p vehicles on another car lot is 25 miles per gallon. When the vehicles on both lots are combined, the average gas mileage is 22.5 miles per gallon. What is the value of (p)/(n) ?

The scatterplot above shows the pH of seven well water samples in West Texas with respect to the bicarbonate concentration in ppm(parts per million). The line of best fit is also shown. According to the scatterplot, which of the following statements about the relationship between a well's pH and its bicarbonate concentration is true?

The figure below shows the relationship between the percent of leaf litter mass remaining after decomposing for 3 years and the mean annual temperature, in degrees Celsius (.^@C) , in 18 forests in Canada. A line of best fit is also shown. A particular forest in Canada, whose data is not included in the figure, had a mean annual temperature of −2^@C . Based on the line of best fit, which of the following is closest to the predicted percent of leaf litter mass remaining in this particular forest after decomposing for 3 years?

The gas mileage for Jan's car is 28 miles per gallon when the car travels at an average speed of 55 miles per hour. The car's gas tank has 20 gallons of gas at the beginning of a trip. If Jan drives at an average speed of 55 miles per hour, Which of the following functions f models the number of gallons of gas remaining in the tank t hours after the trip begins ?

For a new car, the gas mileage in terms of its speed x is modeled by the function G(x)=-1/28x^2+3x-31 , where 15 le x le 90 , and x is speed in miles per hour and G is miles per gallon. At what speed, in miles per hour, does the car attain its best gas mileage ?

PRINCETON-PRACTICE TEST 2-Math test -Calculator
  1. n-sqrt(2n-22)=1 Given the equation above, which of the following is...

    Text Solution

    |

  2. 3x-6=5x-2 Based on the equation above, what is the value of 2x-4?

    Text Solution

    |

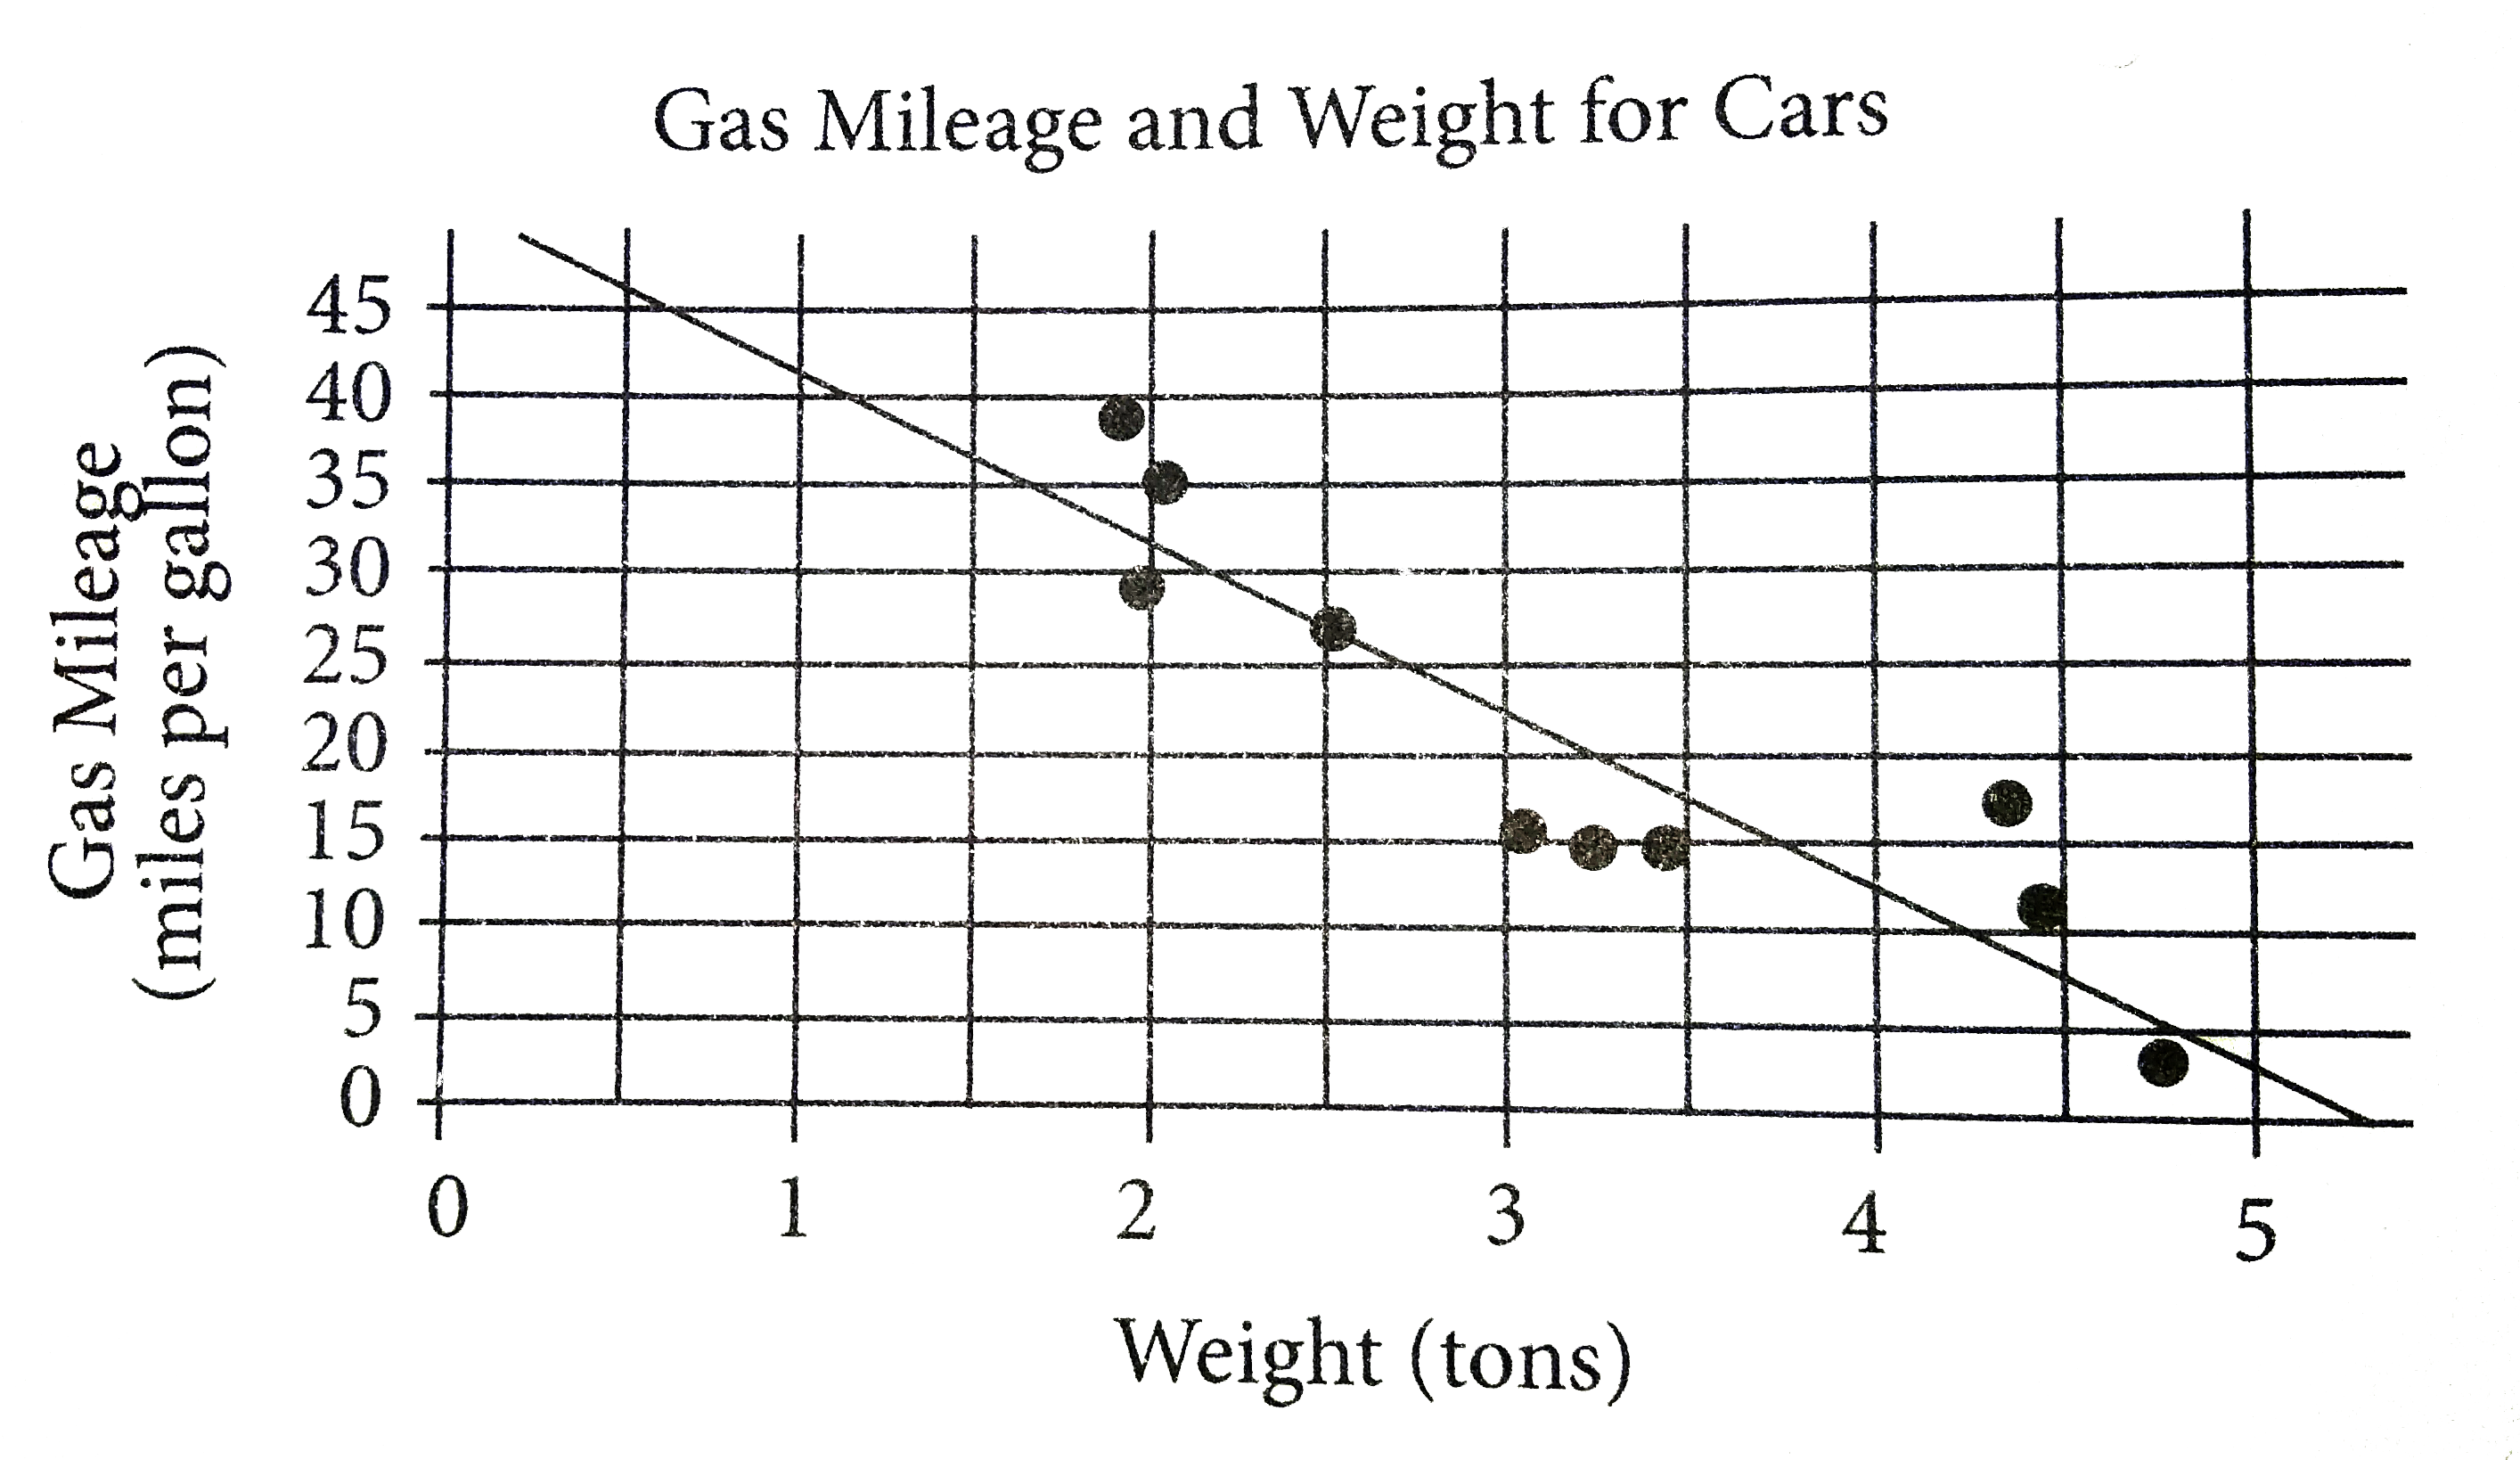
  3. The scatterplot above shows the relationship between gas mileage, in m...

    Text Solution

    |

  4. The graph above shows the average weight for the members of a weight l...

    Text Solution

    |

  5. the figure above represents a circular lake with the walking path that...

    Text Solution

    |

  6. Kanaka took 8 tests for her social studies class. Each test has a maxi...

    Text Solution

    |

  7. A poll of 400 randomly selected likely voters in Seanoa city was taken...

    Text Solution

    |

  8. y^2=21-x x=5 The solutions to the system of equation above are (a1...

    Text Solution

    |

  9. The function p is defined as p(x)=x^2-3x. If the function q is defined...

    Text Solution

    |

  10. If c gt 0 and m and n are postive integers, which of the following is...

    Text Solution

    |

  11. In the figure above, each pulley added to the pulley system after Pull...

    Text Solution

    |

  12. Q=17.6T The equation above shows the heat energy ,Q, in Joules that ...

    Text Solution

    |

  13. the graph above represents the reaction rate,r, at which an unfinished...

    Text Solution

    |

  14. In the figure above, IF cos theta =3/5, what is the value of cos (90-t...

    Text Solution

    |

  15. x+7y=-10 3x-4y=k In the system of equation above,k is a constant. ...

    Text Solution

    |

  16. According to the U.S Department of Labor, the unemployment rate in Jan...

    Text Solution

    |

  17. In a particular college, the test scores of the most recent test given...

    Text Solution

    |

  18. In the figure above, lines p and q are graphed on the xy-plane. What i...

    Text Solution

    |

  19. y=x^2+16x+28 The equation above represents the graph of a parabola i...

    Text Solution

    |

  20. In the figure above, triangle PQR is a similar to triangle XYZ (not sh...

    Text Solution

    |