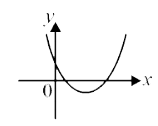
A
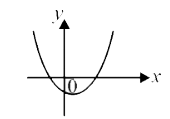
B
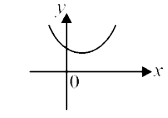
C
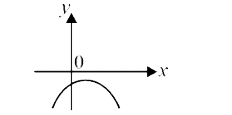
D
Text Solution
Verified by Experts
The correct Answer is:


Similar Questions
Explore conceptually related problems
Recommended Questions
- which of the following graph represents the expression f(x) = ax^2 + b...
Text Solution
|
- If fig shows the graph of f(x)=a x^2+b x+c ,t h e n Fig a c<0 b. b c ...
Text Solution
|
- Let f(x)=ax^2-bx+c^2 != 0 and f(x) != 0 for all x in R. Then (a) a^2+c...
Text Solution
|
- which of the following graph represents the expression f(x) = ax^2 + b...
Text Solution
|
- which one of the following can best represent the graph of quadratic p...
Text Solution
|
- यदि (x+2), व्यंजक ax^(2)+bx+c तथा bx^(2)+ax+c का महत्तम समापवर्तक (HCF...
Text Solution
|
- If f(x)=ax^2 + bx + c , a ne 0 and a, b , and c are all negative , whi...
Text Solution
|
- E1 , a +b +c=0 if 1 is a root of ax ^2 +bx +c=0 . E2 :b ^2-a^2...
Text Solution
|
- If the quadratic equation ax^2+bx+c=0 has -2 as one of its roots then ...
Text Solution
|