A
B
C
D
Text Solution
Verified by Experts
The correct Answer is:


Topper's Solved these Questions
Similar Questions
Explore conceptually related problems
MOTION-ECOLOGY-EXERCISE -3
- In an ecosystem the rate of production of organic matter during photos...
Text Solution
|
- Secondary succession takes place on/in
Text Solution
|
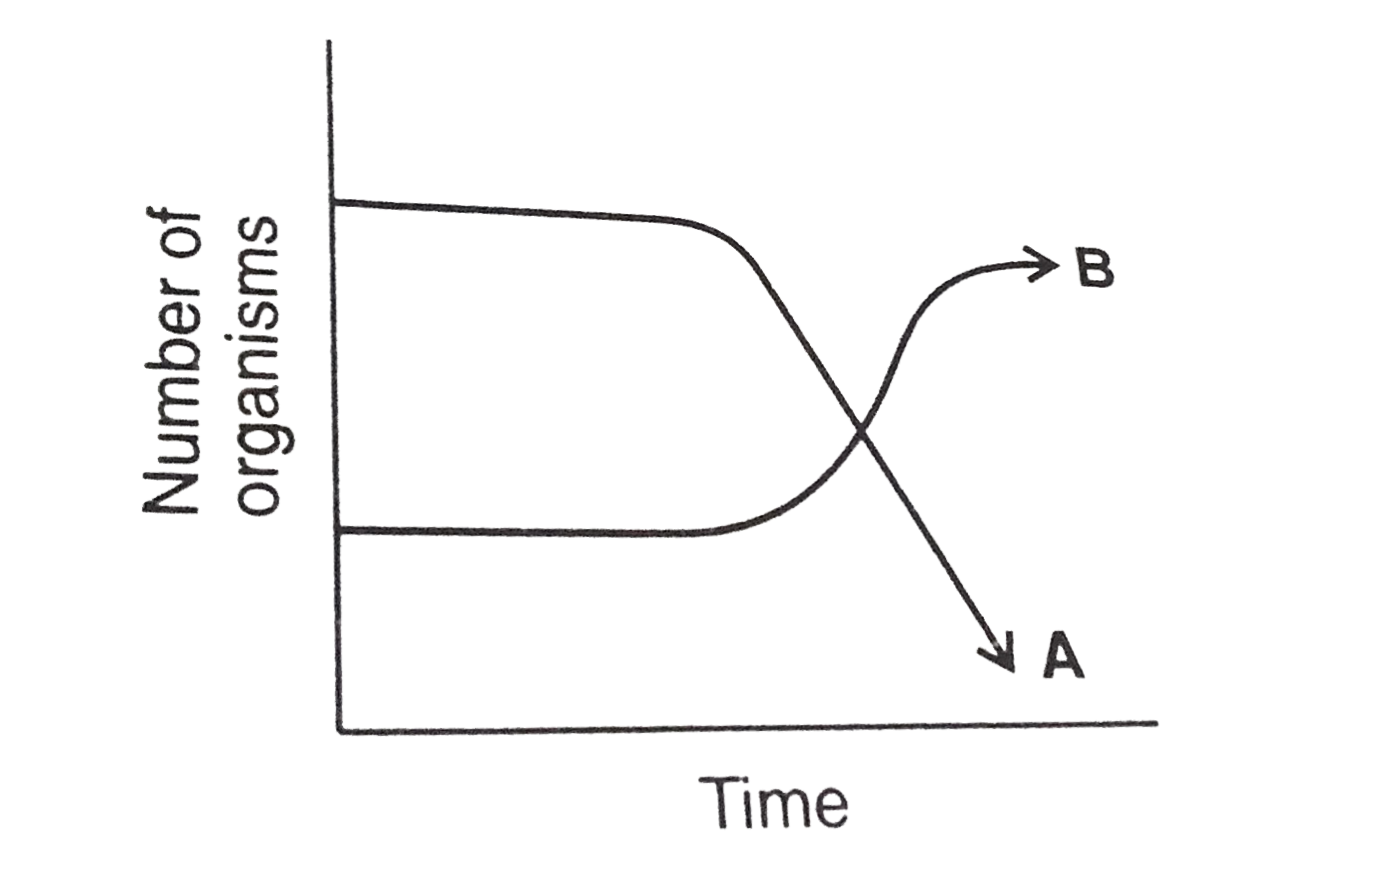
- The following graph depicts changes in two populations (A and B) of he...
Text Solution
|
- Most animals that live in deep oceanic waters are:
Text Solution
|
- An association of individuals of different species living in the same ...
Text Solution
|
- In which of the following both pairs have correct combination?
Text Solution
|
- In which of the following interaction both partners are adversely affe...
Text Solution
|
- The species confined to a particular region and not found elsewhere is...
Text Solution
|
- Eutrophication of water bodies leading to killing of fishes is mainly ...
Text Solution
|
- Acid rain is caused by increase in the atmospheric concentration of :
Text Solution
|
- Increase in concentration of the toxicent at successive trophic level...
Text Solution
|
- During ecological succession
Text Solution
|
- Which of the following are most suitable indicators of SO(2) pollution...
Text Solution
|
- The UN conference of Parties on climate change in the year 2012 was he...
Text Solution
|
- Which of the following is the most important for animals and plants be...
Text Solution
|
- Which one of the following is a characteristic feature of cropland eco...
Text Solution
|
- Joint Forest Management Concept was introduced in India during
Text Solution
|
- The term ecosystem was coined by:
Text Solution
|
- When does the growth rate of a population following the logistic model...
Text Solution
|
- Which of the following would appear as the pioneer organisms on bare r...
Text Solution
|