A
B
C
D
लिखित उत्तर
Verified by Experts


RAKESH YADAV-STATISTICS AND DATA INTERPRETATION-Exercise
- A motorist and a scooterist made a journey of 120 km at the same time ...
Text Solution
|
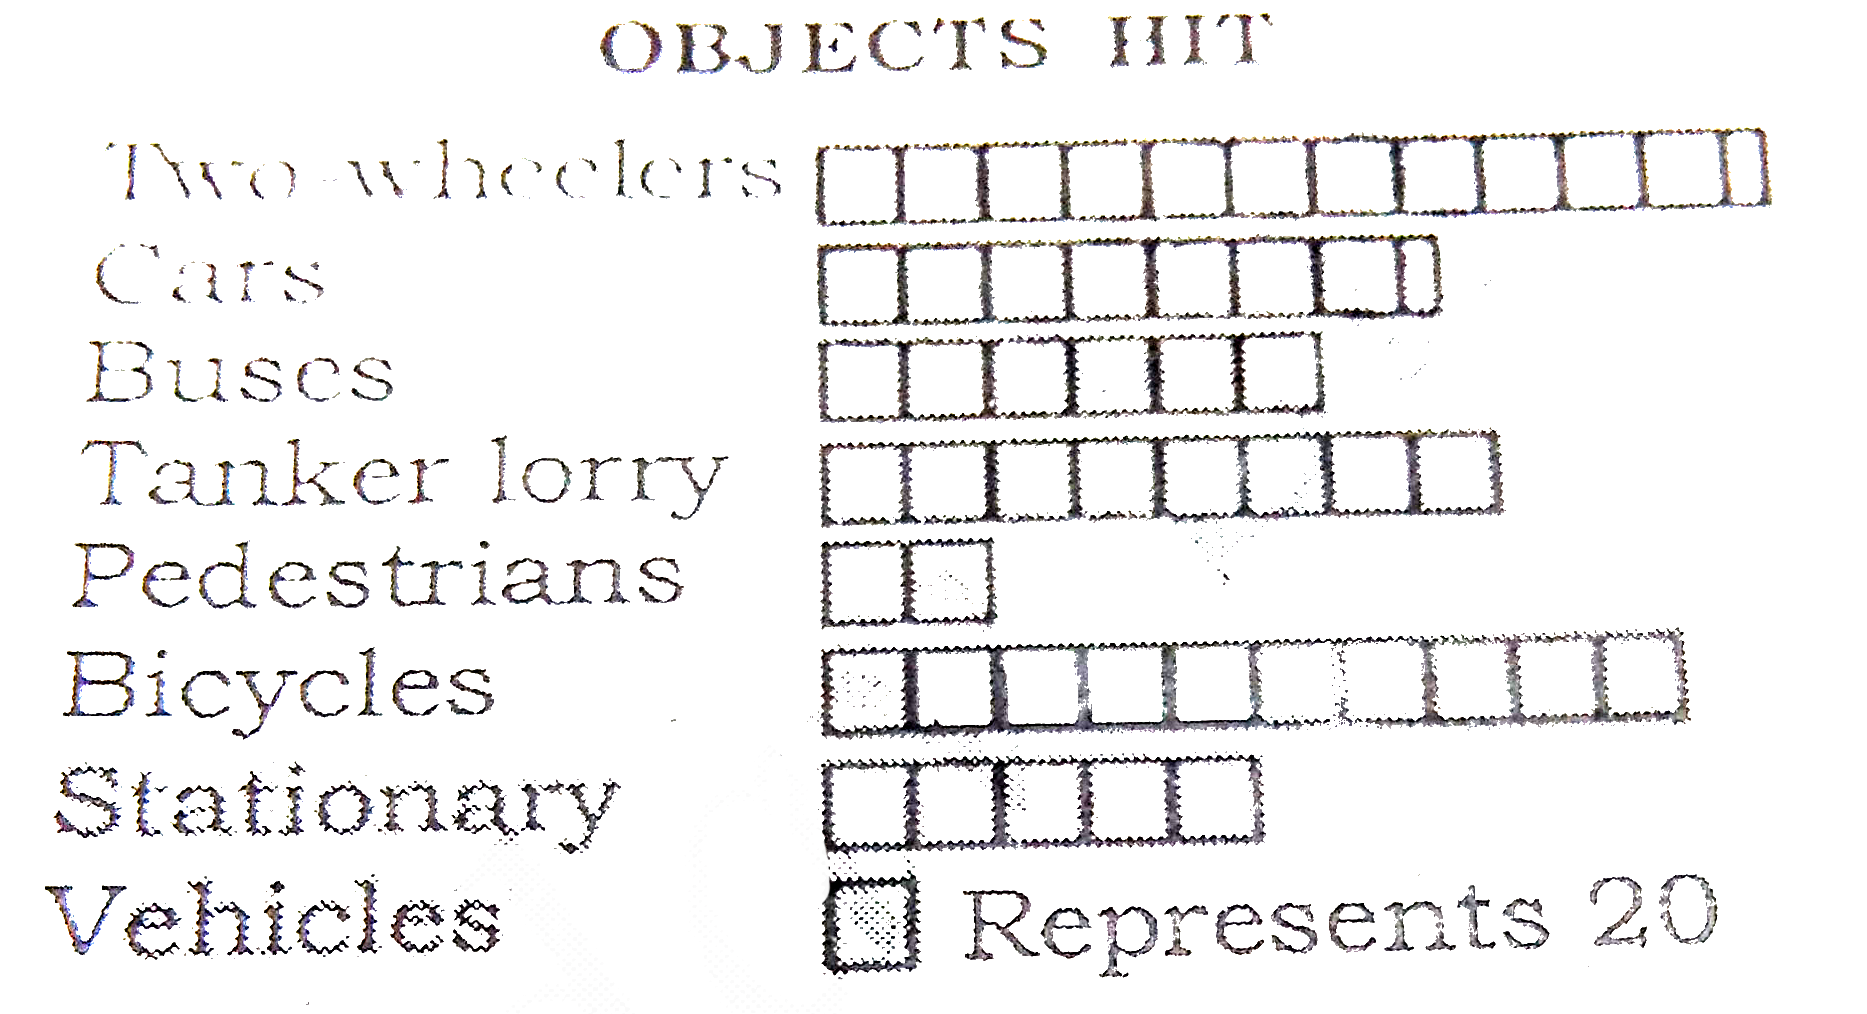
- The following is a horizontal bar diagram showing the accidents in whi...
Text Solution
|
- The following is a horizontal bar diagram showing the accidents in whi...
Text Solution
|
- The following is a horizontal bar diagram showing the accidents in whi...
Text Solution
|
- The following is a horizontal bar diagram showing the accidents in whi...
Text Solution
|
- The following is a horizontal bar diagram showing the accidents in whi...
Text Solution
|
- The bar chart given below shows the percentage distribution of the pro...
Text Solution
|
- The bar chart given below shows the percentage distribution of the pro...
Text Solution
|
- The bar chart given below shows the percentage distribution of the pro...
Text Solution
|
- The bar chart given below shows the percentage distribution of the pro...
Text Solution
|
- The bar chart given below shows the percentage distribution of the pro...
Text Solution
|
- In the following question study the two pie charts and answer the ques...
Text Solution
|
- In the following question study the two pie charts and answer the ques...
Text Solution
|
- In the following question study the two pie charts and answer the ques...
Text Solution
|
- Various expenditures incurred by a publishing company for publishing a...
Text Solution
|
- Various expenditures incurred by a publishing company for publishing a...
Text Solution
|
- Pie charts show the expenses on various heads show the expenses on var...
Text Solution
|
- Pie charts show the expenses on various heads show the expenses on var...
Text Solution
|
- Pie charts show the expenses on various heads show the expenses on var...
Text Solution
|
- The graph given below shows the daily income of 50 workers in a factor...
Text Solution
|