A
B
C
D
लिखित उत्तर
Verified by Experts


RAKESH YADAV-STATISTICS AND DATA INTERPRETATION-Exercise
- Pie charts show the expenses on various heads show the expenses on var...
Text Solution
|
- Pie charts show the expenses on various heads show the expenses on var...
Text Solution
|
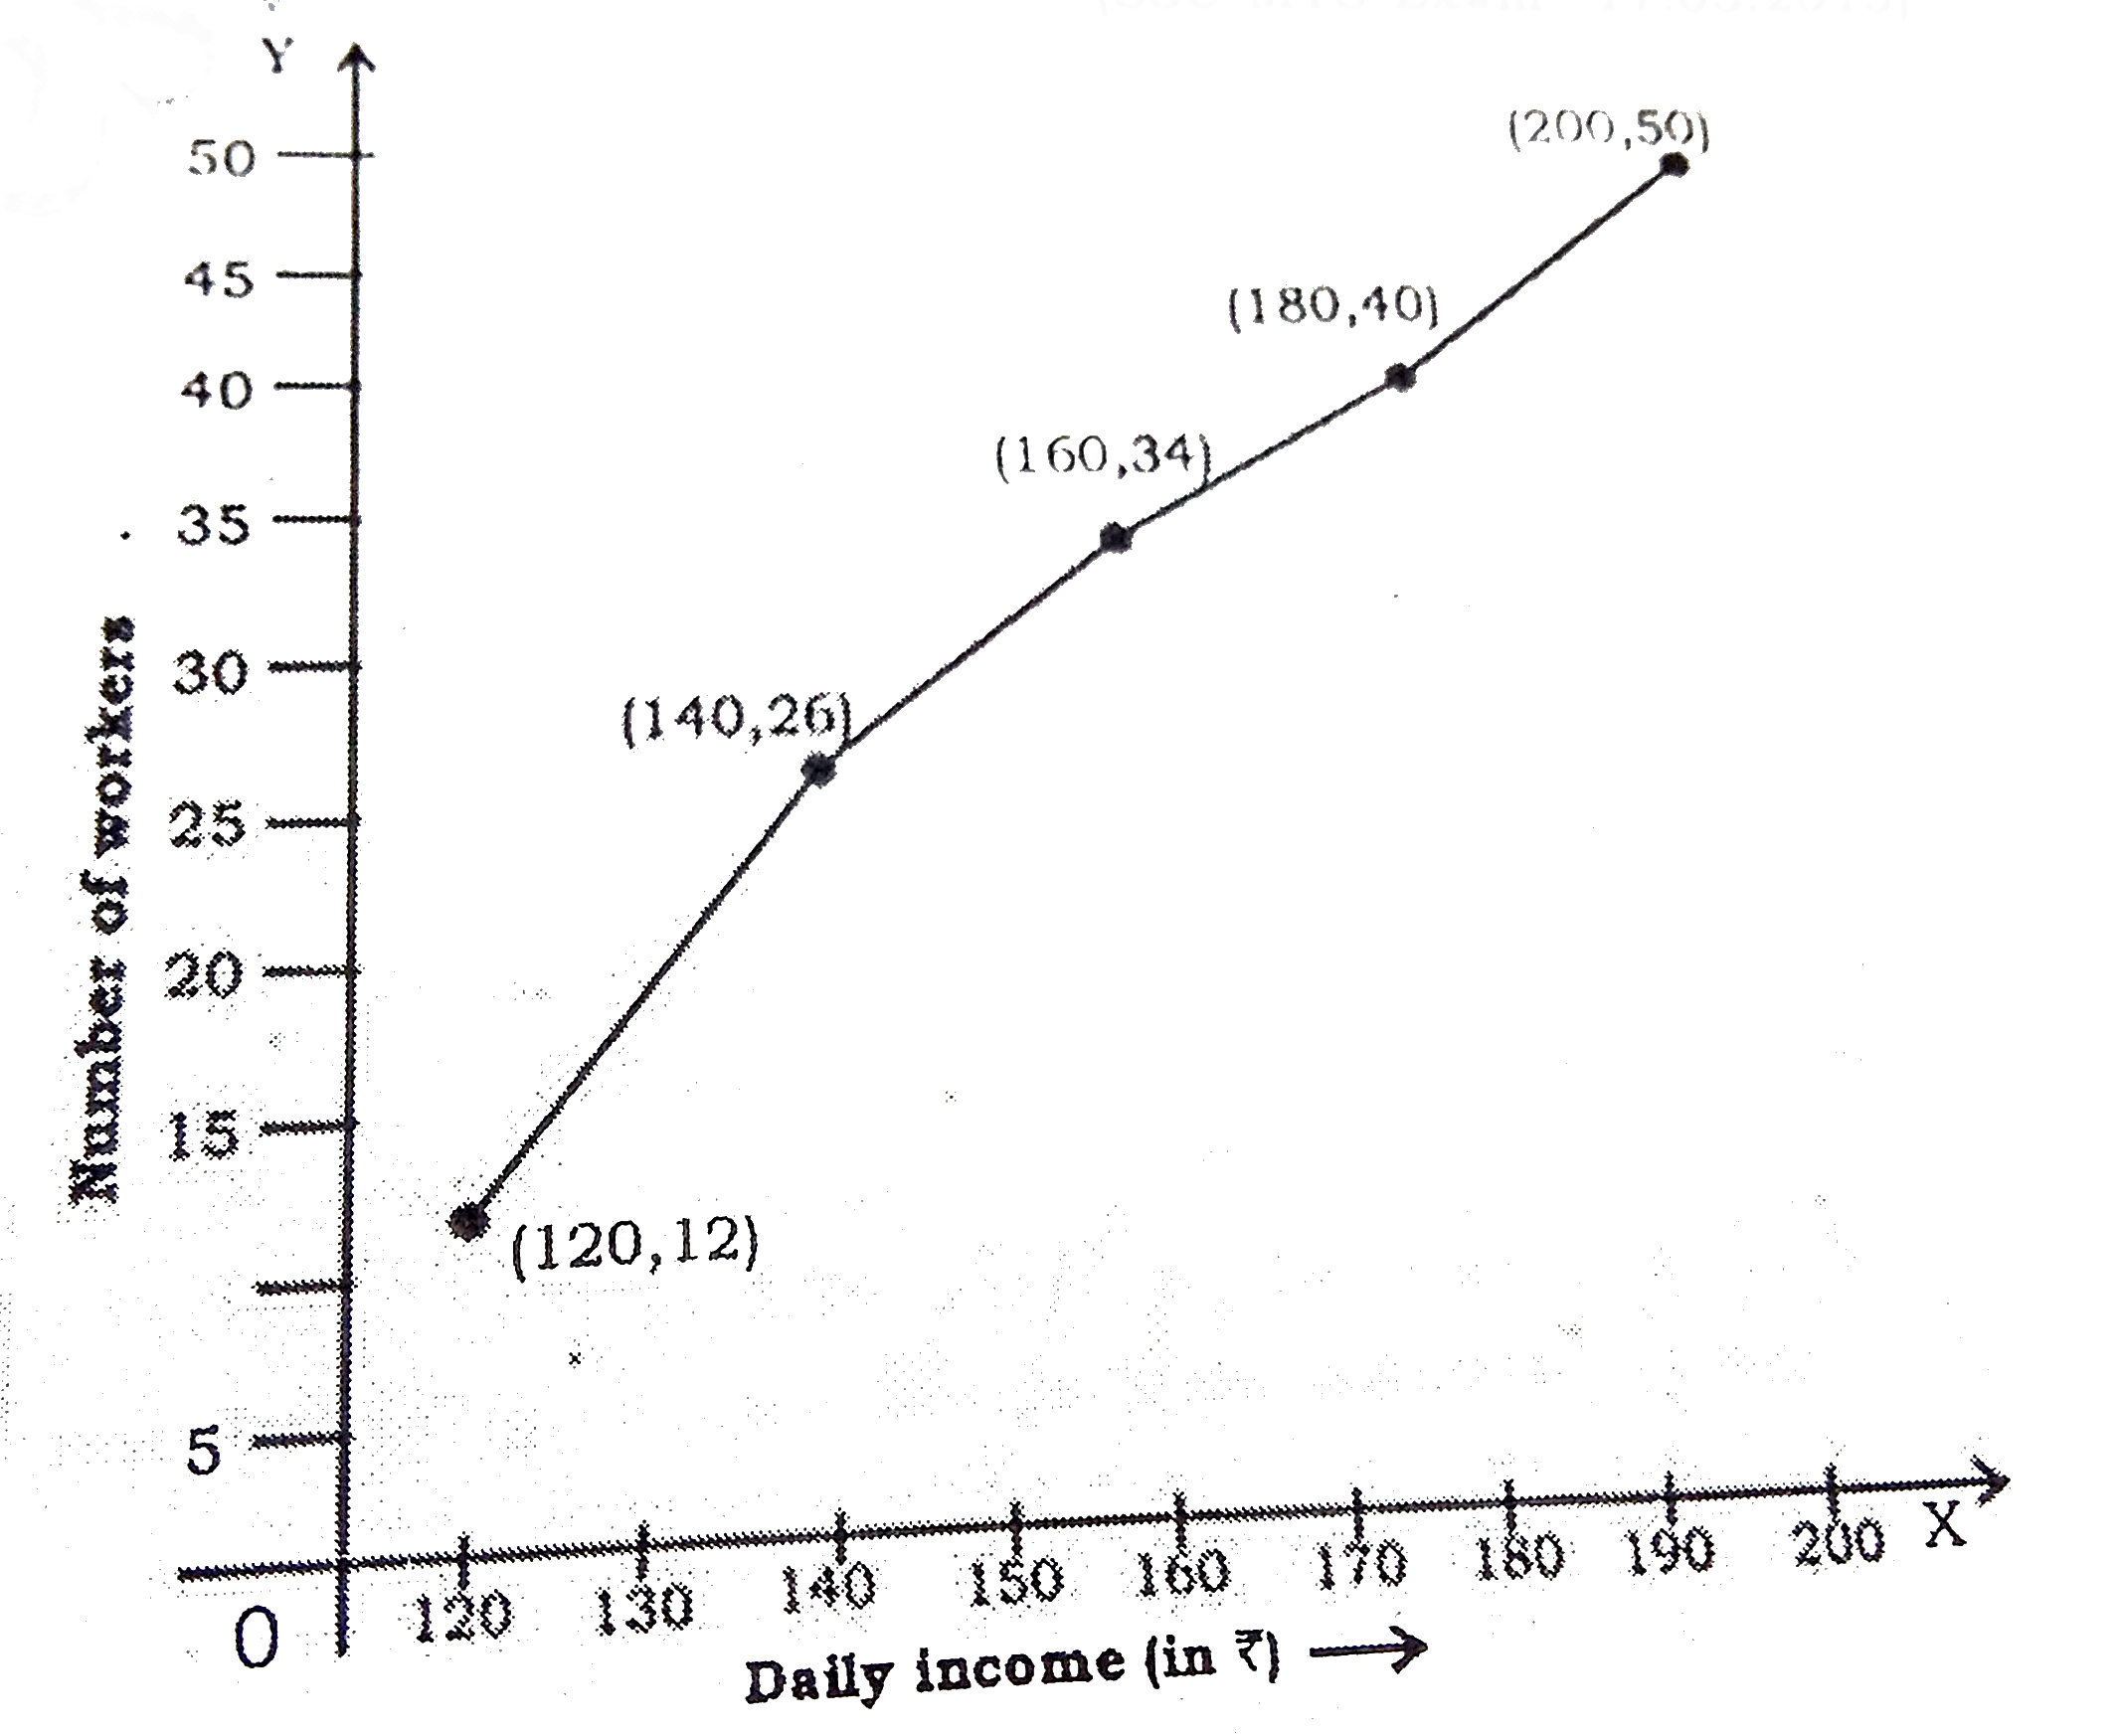
- The graph given below shows the daily income of 50 workers in a factor...
Text Solution
|
- The graph given below shows the daily income of 50 workers in a factor...
Text Solution
|
- Study the following graph and answer the questions 2001 2002 से...
Text Solution
|
- Study the following graph and answer the questions समयांतराल (20...
Text Solution
|
- Study the following graph and answer the questions यदि कंपनी X क...
Text Solution
|
- Study the following graph and answer the questions वर्ष 2005 में ...
Text Solution
|
- The production figures of a perfume manufacturer are given in the form...
Text Solution
|
- The production figures of a perfume manufacturer are given in the form...
Text Solution
|
- The production figures of a perfume manufacturer are given in the form...
Text Solution
|
- In the following questions a graphical representation of income and ex...
Text Solution
|
- In the following questions a graphical representation of income and ex...
Text Solution
|
- Study the following graph and answer the given questions निम्न मे...
Text Solution
|
- Study the following graph and answer the given questions दिए गए स...
Text Solution
|
- Following histogram depicts the range of heights of students in a clas...
Text Solution
|
- Following histogram depicts the range of heights of students in a clas...
Text Solution
|
- Following histogram depicts the range of heights of students in a clas...
Text Solution
|
- The table given below shows production of five types of cars by a comp...
Text Solution
|
- Study the following table and answer the questions वर्ष 2010 से 2...
Text Solution
|