A
B
C
D
लिखित उत्तर
Verified by Experts


RAKESH YADAV-STATISTICS AND DATA INTERPRETATION-Exercise
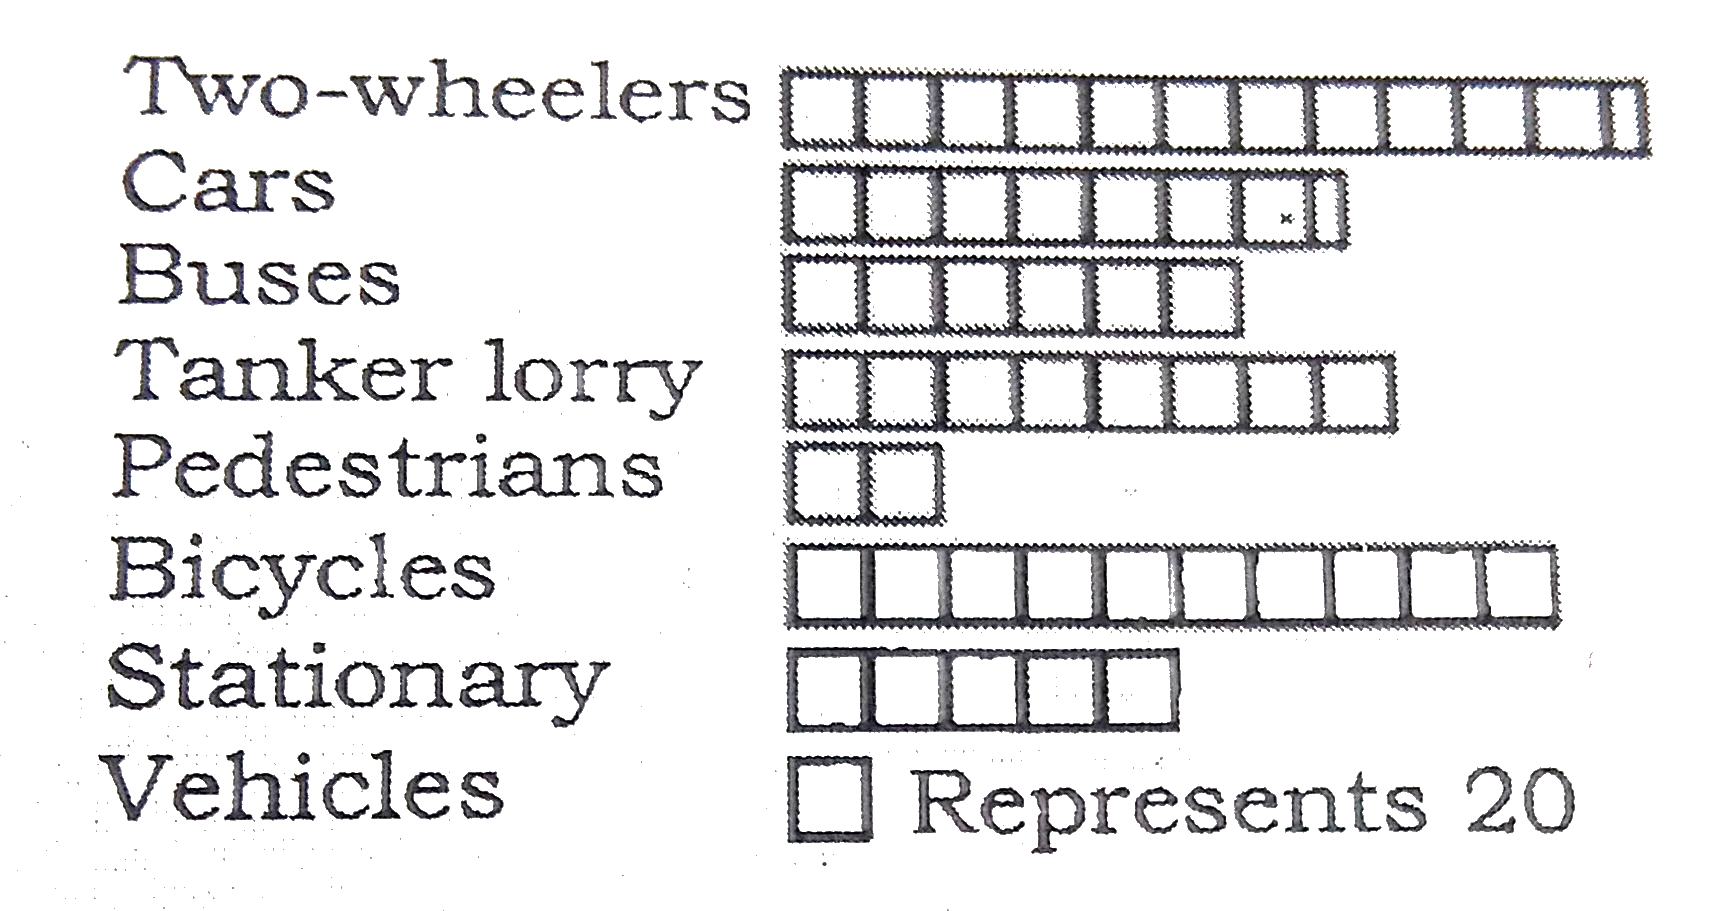
- Study the following graph and answer the given questions निम्न मे...
Text Solution
|
- Study the following graph and answer the given questions दिए गए स...
Text Solution
|
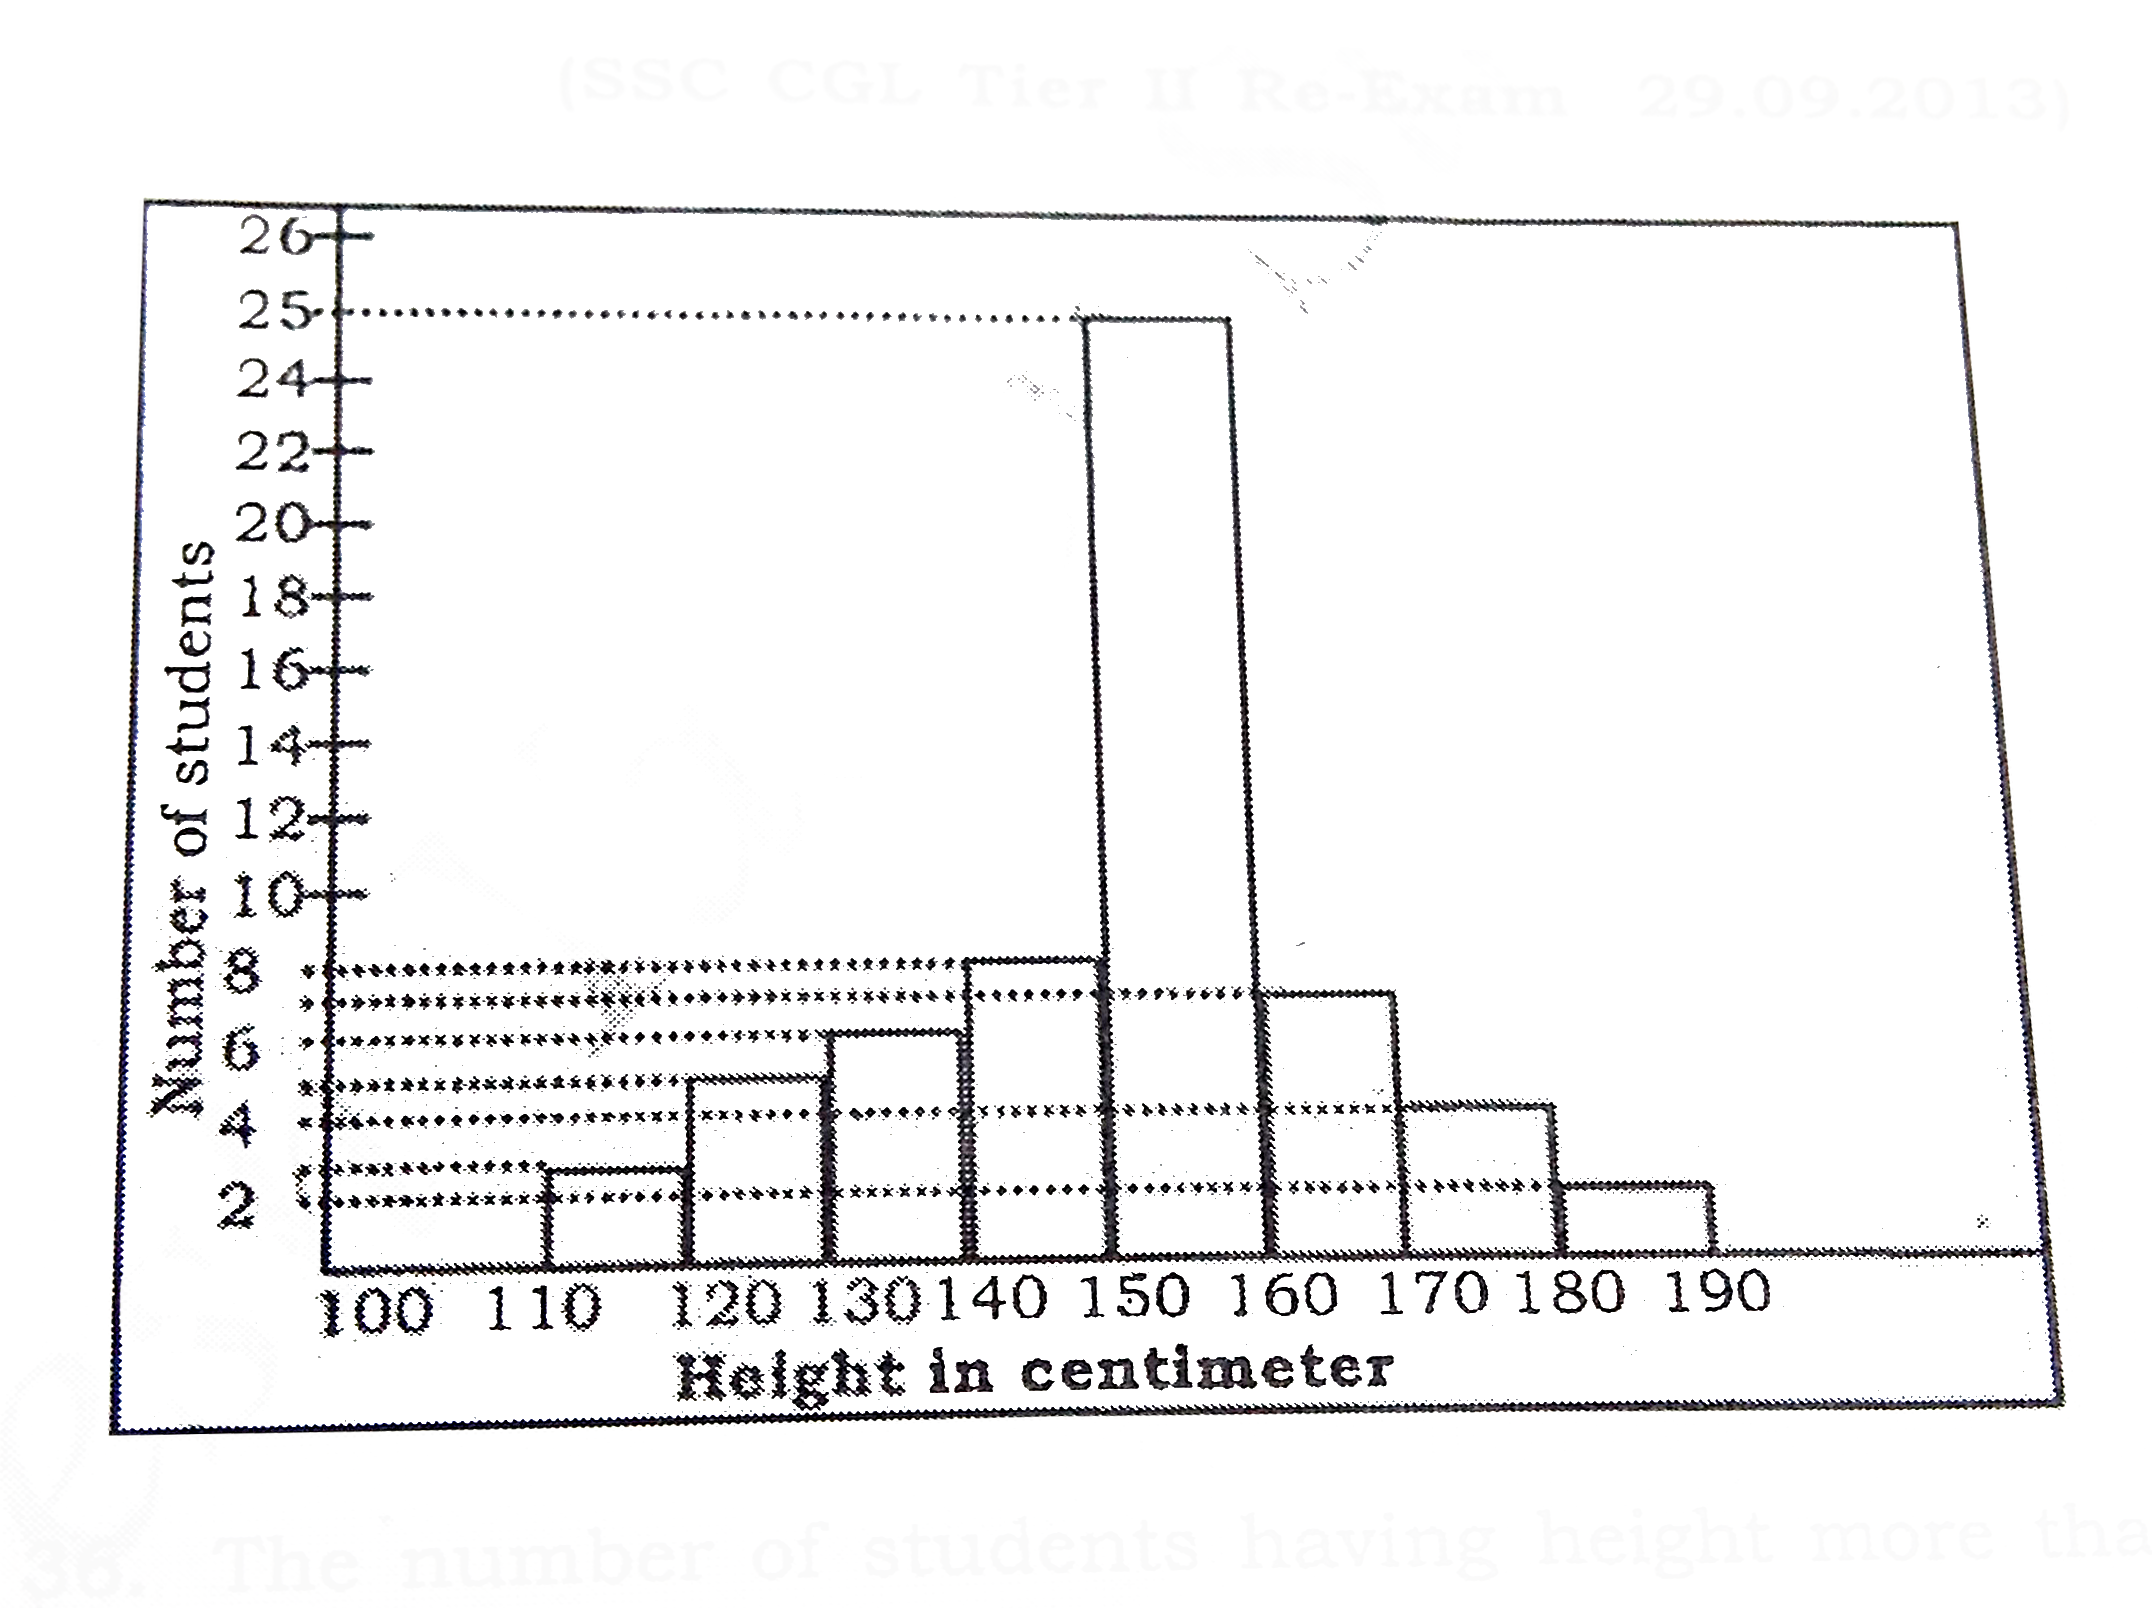
- Following histogram depicts the range of heights of students in a clas...
Text Solution
|
- Following histogram depicts the range of heights of students in a clas...
Text Solution
|
- Following histogram depicts the range of heights of students in a clas...
Text Solution
|
- The table given below shows production of five types of cars by a comp...
Text Solution
|
- Study the following table and answer the questions वर्ष 2010 से 2...
Text Solution
|
- Study the following table and answer the questions वर्ष 2006 से ...
Text Solution
|
- Study the table and answer the questions 150 सेमी से अधिक लम्बाई ...
Text Solution
|
- Study the table and answer the questions 155 सेमी या अधिक लम्बाई ...
Text Solution
|
- The table shows the percentage of toal population of a city in differe...
Text Solution
|
- The table shows the percentage of toal population of a city in differe...
Text Solution
|
- Study the pie chart and table given below and answer the questions De...
Text Solution
|
- Study the pie chart and table given below and answer the questions De...
Text Solution
|
- Study the pie chart and table given below and answer the questions De...
Text Solution
|
- Study the pie chart and table given below and answer the questions De...
Text Solution
|
- The marks obtained by 273 examinees are shown by the frequency polygon...
Text Solution
|
- The marks obtained by 273 examinees are shown by the frequency polygon...
Text Solution
|
- The marks obtained by 273 examinees are shown by the frequency polygon...
Text Solution
|
- The marks obtained by 273 examinees are shown by the frequency polygon...
Text Solution
|