A
B
C
D
लिखित उत्तर
Verified by Experts


RAKESH YADAV-STATISTICS AND DATA INTERPRETATION-Exercise
- The subdivided bar diagram given below depicts the result of B com stu...
Text Solution
|
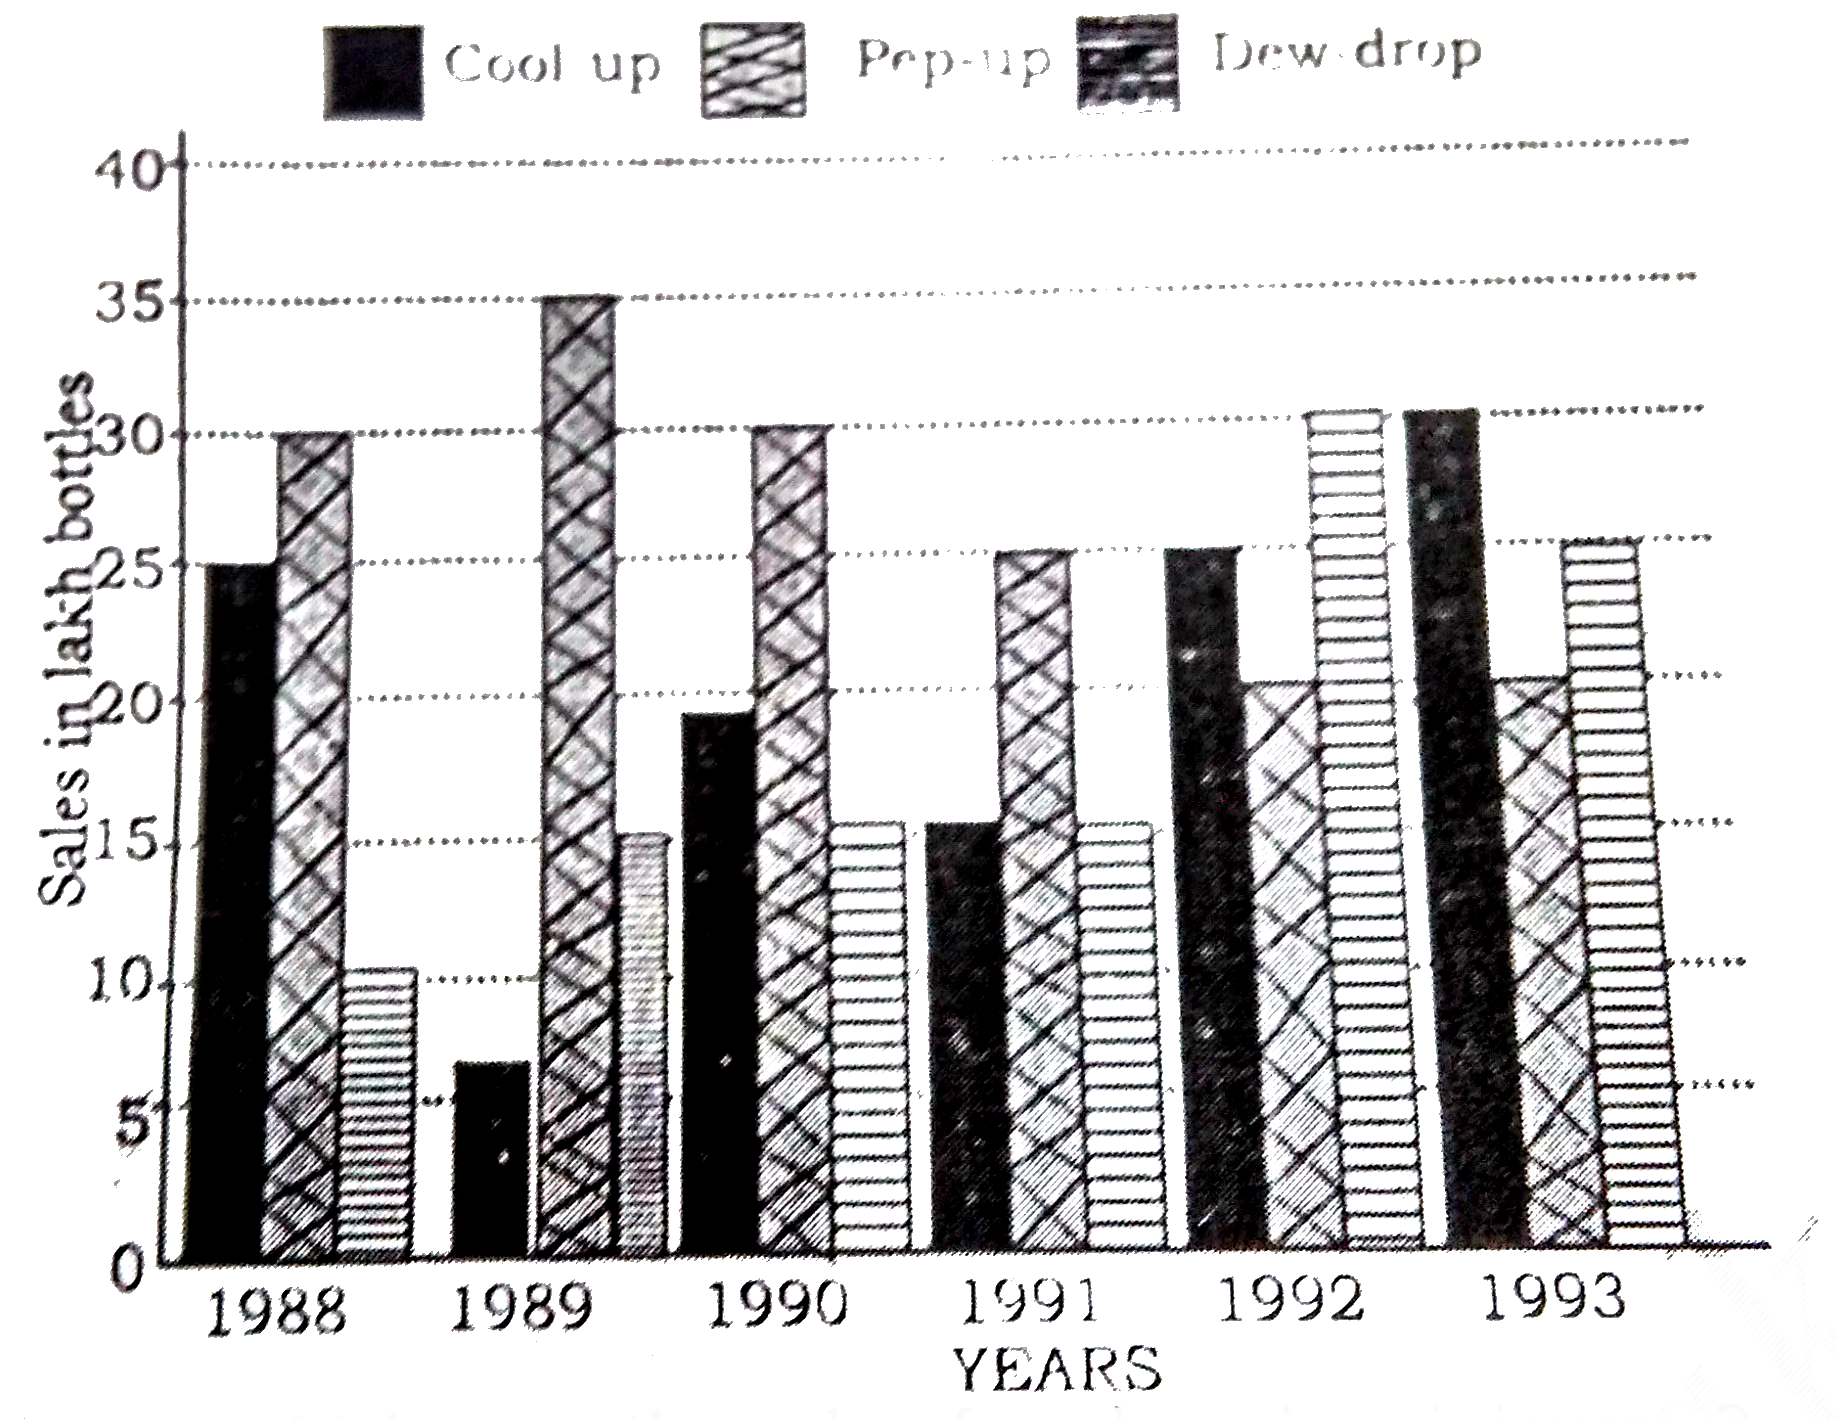
- Study the graph and answer the questions किस वर्ष में कूल उप की...
Text Solution
|
- Study the graph and answer the questions समयावधि 1988-1993 के दौ...
Text Solution
|
- Study the graph and answer the questions वर्ष 1989 की तुलना में व...
Text Solution
|
- Study the graph and answer the questions वर्ष 1989 की तुलना में व...
Text Solution
|
- Study the graph and answer the questions किस वर्ष में डीयू -ड्राप...
Text Solution
|
- Study the graph and answer the questions वर्ष 1988-1993 की समयावध...
Text Solution
|
- Study the bar diagram and answer the following questions Demand and pr...
Text Solution
|
- Study the bar diagram and answer the following questions Demand and pr...
Text Solution
|
- Study the bar diagram and answer the following questions Demand and pr...
Text Solution
|
- Study the bar diagram and answer the following questions Demand and pr...
Text Solution
|
- Study the graph carefully and answer the following questions राज...
Text Solution
|
- Study the graph carefully and answer the following questions निम्...
Text Solution
|
- Study the graph carefully and answer the following questions कितन...
Text Solution
|
- Study the graph carefully and answer the following questions वर्ष...
Text Solution
|
- The subject wise number of applicants for the year 2008 and 2009 in a ...
Text Solution
|
- The subject wise number of applicants for the year 2008 and 2009 in a ...
Text Solution
|
- The subject wise number of applicants for the year 2008 and 2009 in a ...
Text Solution
|
- The subject wise number of applicants for the year 2008 and 2009 in a ...
Text Solution
|
- The subject wise number of applicants for the year 2008 and 2009 in a ...
Text Solution
|