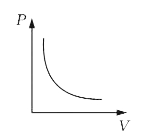
A
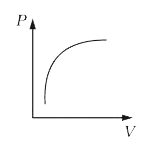
B
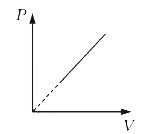
C
D
Text Solution
Verified by Experts
The correct Answer is:


Similar Questions
Explore conceptually related problems
Recommended Questions
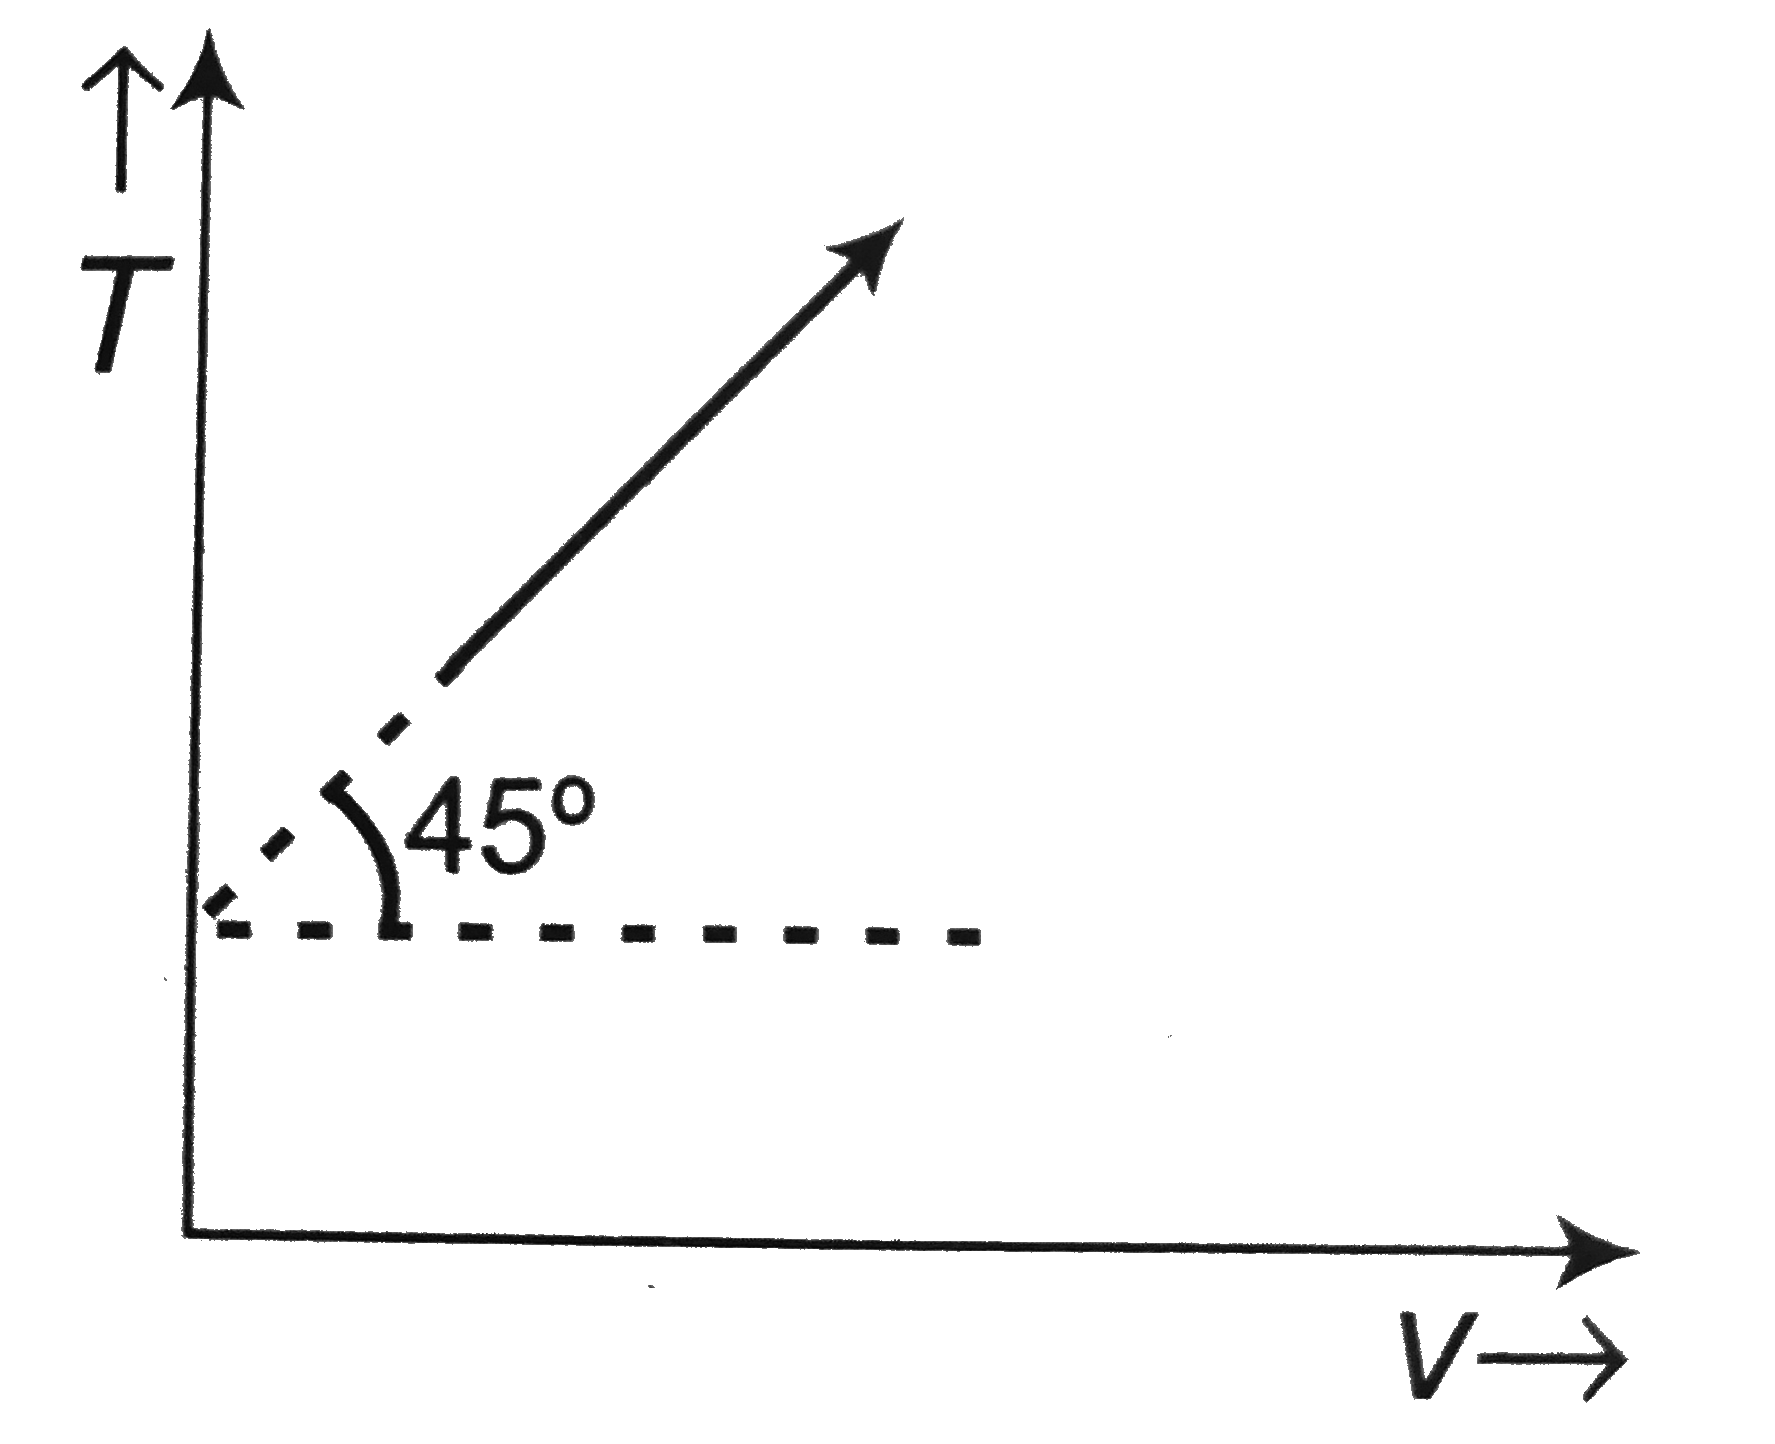
- The given curve represents the variation of temperature as a function ...
Text Solution
|
- At a constant pressure, of the following graphs that one which represe...
Text Solution
|
- The given curve represents the variation of temperature as a function ...
Text Solution
|
- Which of the following curve represent variation of density of water w...
Text Solution
|
- Which of the following volume (V)-temperature (T) plots represents the...
Text Solution
|
- Which of the following volume (V) - temperature (T) plots represents t...
Text Solution
|
- Which of the following volume-temperature (V-I) plots represents the b...
Text Solution
|
- Which of the following volume (V)-temperature (T) plots represents the...
Text Solution
|
- If heat energy is given to an ideal gas at constant pressure, then sel...
Text Solution
|