A
B
C
D
Text Solution
Verified by Experts
The correct Answer is:


Similar Questions
Explore conceptually related problems
Recommended Questions
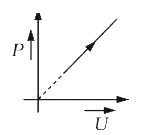
- The given P-U graph shows the variation of internal energy of an ideal...
Text Solution
|
- For the given graph which of the following is correct : (n = mole of g...
Text Solution
|
- Choose the correct graph between pressure and volume of ideal gas.
Text Solution
|
- When does the graph showing variation of the volume of a given mass of...
Text Solution
|
- If the internal energy of an ideal gas U and volume V are doubled, the...
Text Solution
|
- The given P-U graph shows the variation of internal energy of an ideal...
Text Solution
|
- Plot a graph between internal energy U and Temperature (T) of an ideal...
Text Solution
|
- If heat energy is given to an ideal gas at constant pressure, then sel...
Text Solution
|
- निम्न में से कौन - सा आयतन (V), ताप (T) ग्राफ ( आलेख ) , एक वायुमंडल...
Text Solution
|