A
B
C
D
Text Solution
Verified by Experts
The correct Answer is:


Similar Questions
Explore conceptually related problems
Recommended Questions
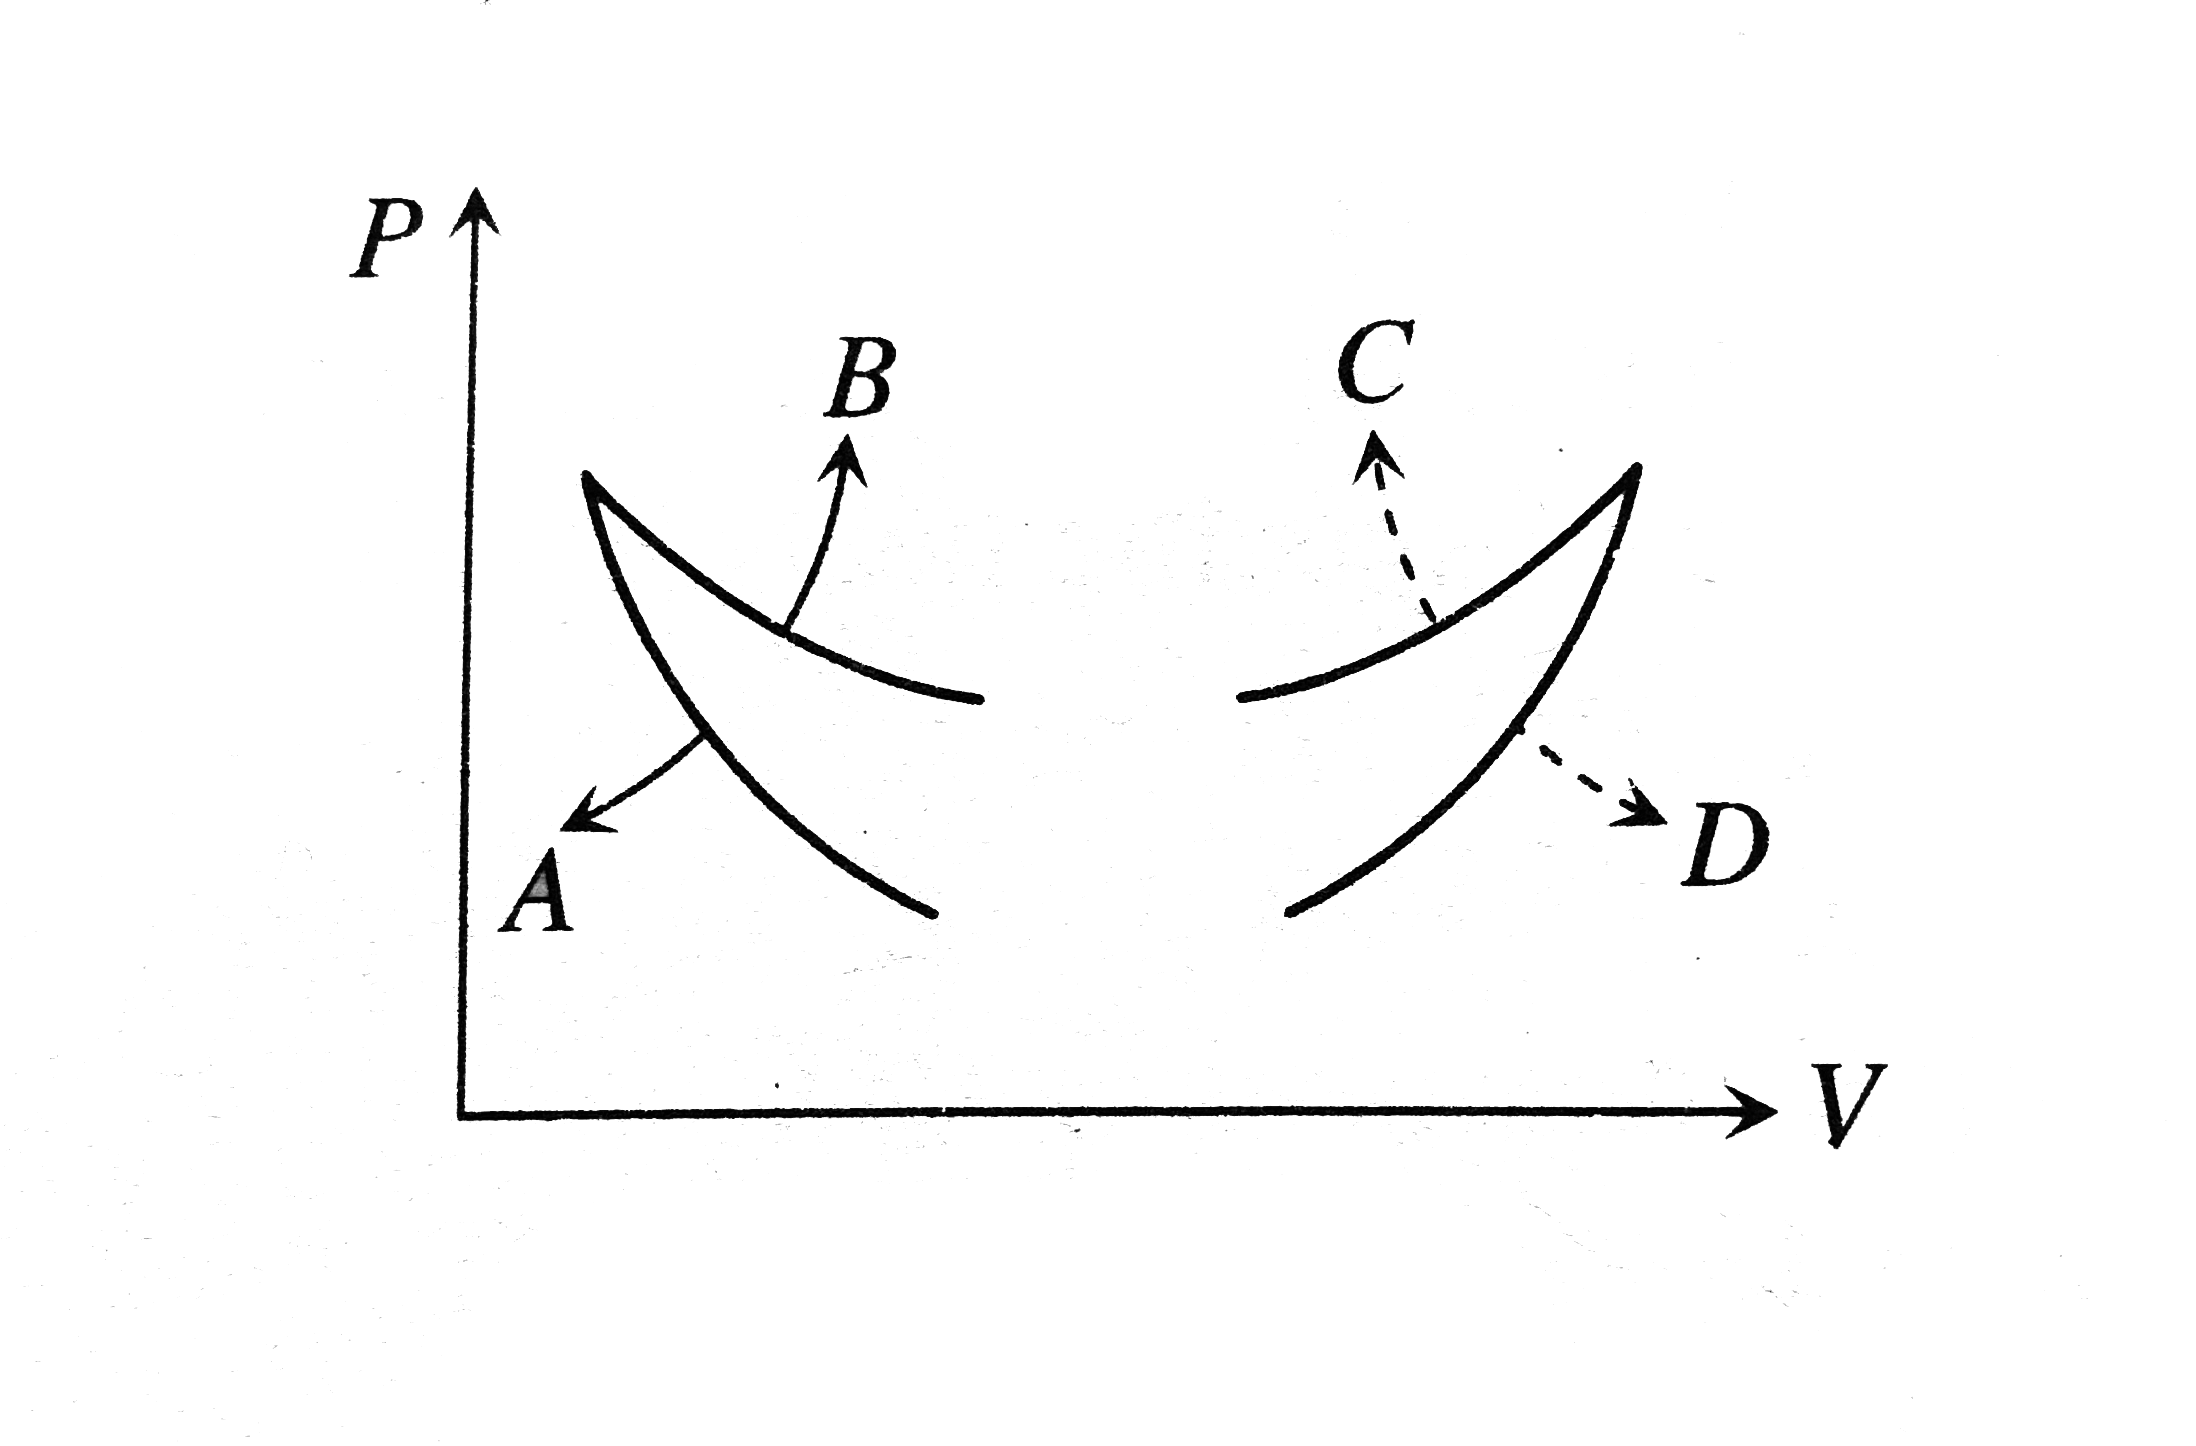
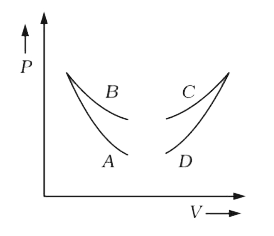
- Four curves A, B, C and D are drawn in Fig. for a given amount of gas....
Text Solution
|
- The curves A and B in the figure shown P-V graphs for an isothermal an...
Text Solution
|
- Four curves A,B,C and D are drawn in figure for a given amount of gas....
Text Solution
|
- Four curves A, B, C and D are drawn in Fig. for a given amount of gas....
Text Solution
|
- In the given graph, adiabatic and isothermal curves are shown. Then,
Text Solution
|
- संलग्न चित्र 22.8 में गैस की किसी दी हुई मात्रा के लिए चार वक्र A, B, ...
Text Solution
|
- The gas law(PV)/(T)= constant is true for (A) Isothermal changes onl...
Text Solution
|
- Four curves A, B, C and D are shown in Fig. 4 for the given journey. F...
Text Solution
|
- ab and bc curves in the figure represent an isothermal and an adiabati...
Text Solution
|