Home
Class 12
PHYSICS
The graph between (P/T) and T for a gas ...

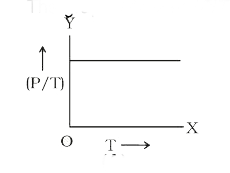
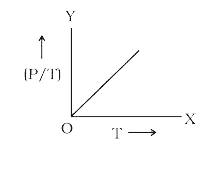
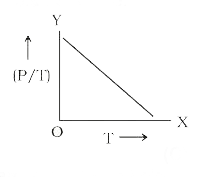
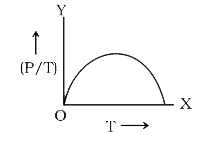
The graph between (P/T) and T for a gas at constant volume will be:

A

B

C

D

Text Solution

AI Generated Solution

The correct Answer is:
To solve the problem of determining the graph between \( \frac{P}{T} \) and \( T \) for a gas at constant volume, we can follow these steps: ### Step 1: Understand the Ideal Gas Law The ideal gas law is given by the equation: \[ PV = nRT \] where \( P \) is the pressure, \( V \) is the volume, \( n \) is the number of moles, \( R \) is the gas constant, and \( T \) is the temperature. ### Step 2: Identify the Given Condition In this problem, we are told that the volume \( V \) is constant. This means that for a given amount of gas, the number of moles \( n \) and the gas constant \( R \) are also constant. ### Step 3: Rearranging the Ideal Gas Law Since \( V \) is constant, we can rearrange the ideal gas law to express pressure \( P \) in terms of temperature \( T \): \[ P = \frac{nRT}{V} \] ### Step 4: Express \( \frac{P}{T} \) Now, we can express \( \frac{P}{T} \): \[ \frac{P}{T} = \frac{nR}{V} \] This shows that \( \frac{P}{T} \) is constant because \( n \), \( R \), and \( V \) are all constants. ### Step 5: Graphing \( \frac{P}{T} \) against \( T \) Since \( \frac{P}{T} \) is constant, when we plot \( \frac{P}{T} \) on the y-axis against \( T \) on the x-axis, we will get a horizontal line. This indicates that regardless of the temperature \( T \), the value of \( \frac{P}{T} \) remains the same. ### Conclusion Thus, the graph between \( \frac{P}{T} \) and \( T \) for a gas at constant volume will be a horizontal line. ---

To solve the problem of determining the graph between \( \frac{P}{T} \) and \( T \) for a gas at constant volume, we can follow these steps: ### Step 1: Understand the Ideal Gas Law The ideal gas law is given by the equation: \[ PV = nRT \] where \( P \) is the pressure, \( V \) is the volume, \( n \) is the number of moles, \( R \) is the gas constant, and \( T \) is the temperature. ...
Promotional Banner

Similar Questions

Explore conceptually related problems

The ideal gas equation for 1 mol of ideal gas is PV = nRT graph between P and T at constant volume, i.e. isochores are plotted as under Which of the following order of volume is correct ?

Given is the graph between (PV)/T and P for 1 gm of oxygen gas at two different temperatures T_(1) and T_(2) Fig. Given, density of oxygen = 1.427 kg m^(-3) . The value of (PV)//(T) at the point A and the relation between T_(1) and T_(2) are respectively :

If P is doubled and T is reduced to half at constant volume, what will be its effect on the mean free path ( lambda ) of a gas molecule?

The molar heat capacity of a perfect gas at constant volume is C_v . The gas is subjected to a process T =T_0e^(AV) , Where T_0 and A are constant. Calculate the molar heat capacity of the gas a function of its volume

The molar heat capacity for a gas at constant T and P is

The graph between pressure P and volume V for a given mass of a gas a fixed temperature T is a ________ .

The equation of a certain gas can be written as (T^(7//5))/(P^(2//5))= cons tan 1 . Its specific at constant volume will be.

A plot of P vs T for a given mass of gas at constant volume is a straight line . P vs T at constant volumes V_(1) and V_(2) for an ideal gas are shown below : Which of the following is correct ?