A
B
C
D
Text Solution
Verified by Experts
The correct Answer is:


Similar Questions
Explore conceptually related problems
Recommended Questions
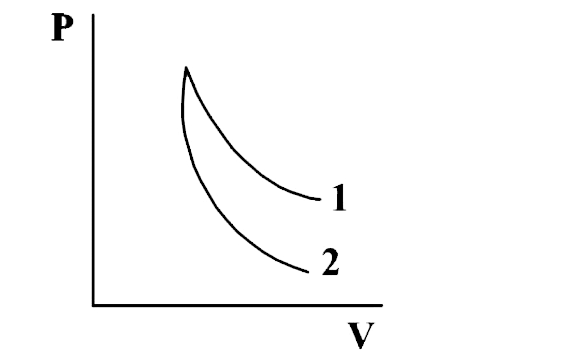
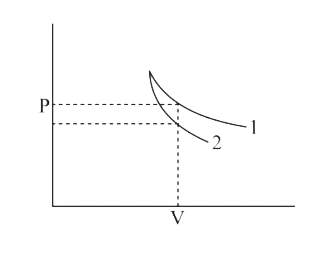
- P-V plots for two gases during adiabatic processes are shown in the fi...
Text Solution
|
- P-V plots for two gases during adiabatic processes are shown in the fi...
Text Solution
|
- P-V plots for two gases during adiabatic expansion are shown in figure...
Text Solution
|
- P-V plot for two gases ( assuming ideal ) during adiabatic processes a...
Text Solution
|
- P-V plot for two gases (assuming ideal) during adiabatic processes are...
Text Solution
|
- P-V plots for two gases during an adiabatic process are given in the f...
Text Solution
|
- P-V plot for two gases (assuming ideal) during adiabatic processes are...
Text Solution
|
- P - V plots for two gases, undergoing adiabatic processes are as shown...
Text Solution
|
- P-V plots for two gases during adiabatic processes are shown in the fi...
Text Solution
|