Text Solution
Verified by Experts
The correct Answer is:


Similar Questions
Explore conceptually related problems
Recommended Questions
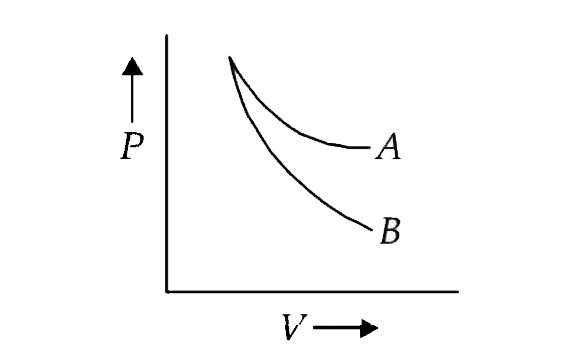
- The curves A and B in the figure shown P-V graphs for an isothermal an...
Text Solution
|
- The curves A and B in the figure shown P-V graphs for an isothermal an...
Text Solution
|
- Assertion: Isothermal and adiabatic, two processes are shown on p-V di...
Text Solution
|
- In the given graph, adiabatic and isothermal curves are shown. Then,
Text Solution
|
- Which of the following P-V curve best represents. As isothermal proces...
Text Solution
|
- निम्नलिखित कथन सत्य है अथवा असत्य? चित्र में दो वक्र A तथा B एक आदर्श...
Text Solution
|
- Which of the following P-V curve best represents. As isothermal proces...
Text Solution
|
- Draw P-V curves for isothermal and adiabatic processes of an ideal gas...
Text Solution
|
- ab and bc curves in the figure represent an isothermal and an adiabati...
Text Solution
|