A
B
C
D
Text Solution
Verified by Experts
The correct Answer is:


Recommended Questions
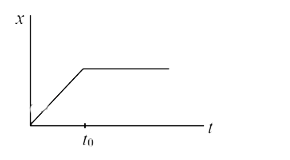
- Figure shows the position-time graph of a particle moving on the X--ax...
Text Solution
|
- Figure shows the displacement time graph of a particle moving on the X...
Text Solution
|
- Figure shows the position of a particle moving on the X-axis as a func...
Text Solution
|
- Figure shows the position the graph for a particle in one dimensional ...
Text Solution
|
- The velocity-time graph for a particle moving along X-axis is shown in...
Text Solution
|
- The velocity time graph for a particle moving along x-axis is shown in...
Text Solution
|
- Figure shows the position-time graph of a particle moving on the X--ax...
Text Solution
|
- Figure shows the position of a particle moving on the x - axis as a fu...
Text Solution
|
- The velocity time graph for a particle moving along X-axis is shown in...
Text Solution
|