To solve the problem step by step, we will analyze the motion of the ball as it falls and rebounds after colliding with the ground.
### Step 1: Understanding the Initial Conditions
The ball is dropped from a height \( h \) with an initial velocity \( u = 0 \). When it falls freely under gravity, its velocity just before hitting the ground can be calculated using the equation of motion:
\[
v^2 = u^2 + 2gh
\]
Since \( u = 0 \), we have:
\[
v = \sqrt{2gh}
\]
**Hint:** Remember that the final velocity before impact can be derived from the kinematic equations.
### Step 2: Analyzing the Collision
Upon colliding with the ground, the ball's velocity is halved. Therefore, after the first collision:
\[
v' = \frac{v}{2} = \frac{\sqrt{2gh}}{2} = \frac{\sqrt{2gh}}{2}
\]
### Step 3: Motion After the First Collision
After the first collision, the ball will ascend to a height \( h_1 \) before falling again. The maximum height reached can be calculated using:
\[
v'^2 = 0 + 2gh_1 \implies h_1 = \frac{(v')^2}{2g} = \frac{(\frac{\sqrt{2gh}}{2})^2}{2g} = \frac{2gh}{4 \cdot 2g} = \frac{h}{4}
\]
### Step 4: Repeat the Process
After reaching height \( h_1 \), the ball will fall again, collide with the ground, and its velocity will again be halved. This process will continue, leading to heights \( h_2, h_3, \) etc., where:
\[
h_2 = \frac{h_1}{4} = \frac{h}{16}, \quad h_3 = \frac{h_2}{4} = \frac{h}{64}, \ldots
\]
### Step 5: Graphs Analysis
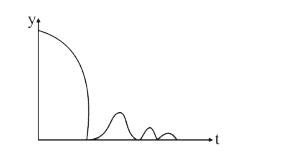
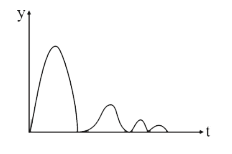
1. **Height vs. Time Graph (y vs. t)**: The ball starts from height \( h \) and decreases to 0, then rebounds to \( h/4 \), and so on. The graph will show a decreasing curve with a series of peaks at decreasing heights.
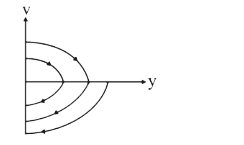
2. **Velocity vs. Height Graph (v vs. y)**: The velocity decreases as the height decreases. The graph will be a downward sloping curve, indicating that as the height above the ground decreases, the velocity increases until it reaches the peak height after each bounce.
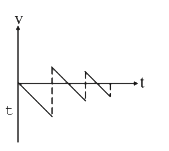
3. **Velocity vs. Time Graph (v vs. t)**: The velocity will be negative while falling (increasing in magnitude) and will be positive while ascending (decreasing in magnitude). The graph will show a linear decrease during the fall and a linear increase during the ascent, with the slopes reflecting the acceleration due to gravity.
### Conclusion
Based on the analysis, the correct graphs are:
- Height vs. Time: A decreasing curve with peaks.
- Velocity vs. Height: A downward sloping curve.
- Velocity vs. Time: A linear graph with negative slope during descent and positive slope during ascent.
**Final Answer:** The correct options are A, B, and D.